
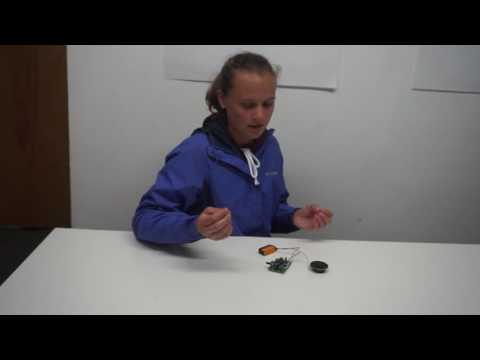
Hey! I am Sophie Richards, and I am a rising junior at The Urban School. I am interested in Biomedical Engineering. For my main project I am building a Heart Rate Monitor, which consists of a fair amount of electrical engineering. My starter project is a Voice Changer that, when spoken into, changes the pitch of your voice. Below is my documentation for the six weeks that I attended Bluestamp Engineering. I didn’t come to Bluestamp knowing everything, so here are my sources used for documentation and understanding. Here is my Bill of Materials and the schematic that was provided when I received the project. I had to write my own code because the original code was meant for an LCD and not a TFT. Here is the zip to download my code .Check it out!
My goal entering Bluestamp was to be able to come out and build projects on my own. Not only did I achieve that goal, but I also learned how to design my own projects and what tools to use when figuring out why a project isn’t performing the correct function. I came in interested in electrical engineering and I am coming out still interested in that field, but I want to incorporate biomedical engineering into that. My project combined both of my interests, and I hope to make more medical devices that can help people in need.
Final Project

Final Video:
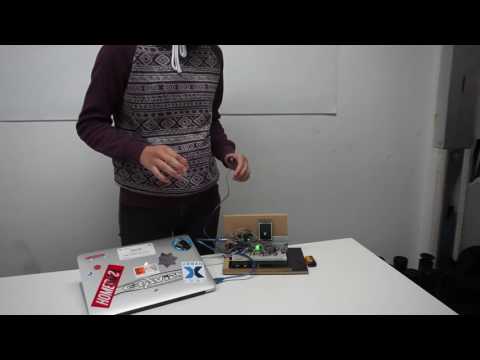
My final project is a Heart Rate Monitor that displays your heart beat and counts your beats per minute. The first step was to build an amplifying circuit that enlarged the signal from my heartbeat making it easily read by the arduino and later displayed on the TFT. The next step was to find the heartbeat using electrodes and send the signal to the oscilloscope in order to see what the current looked like. That step took me about two weeks because a heartbeat is so small. I couldn’t find a pulse with electrodes so I switched to a finger pulse sensor. The pulse sensor shines light on my finger to see how much blood is in it, and the amount of light that comes back is the signal. After my heartbeat was being displayed on the oscilloscope I hooked my pulse sensor up to my finger and ran it through my circuit. Before running the signal through the circuit I had to write the code for my arduino in order for the signal to display on the TFT. I started that process by taking an example code for how to write a line across the screen. After learning how to display a line on my TFT I wrote code for my arduino to display a line of the signal by plotting it on the screen. My last step was teaching my arduino how to count beats per minute. When my signal went from being under a certain point and then above, that was counted as one beat. I took readings every six seconds before the screen would reset. All I had to do from there was multiply how many beats it sensed in six seconds by ten to display how many beats per minute my heart rate was running at. After it calculates the BPM the arduino gives you a diagnosis depending on the measure of your BPM. The code below is the segment of my main code for diagnosing the patient.
tft.fillScreen(BACKCOLOR);//cut off =800
tft.setTextColor(ILI9340_GREEN);
tft.setTextSize(3);
tft.setCursor(89,200);
tft.println(“BPM”);
tft.setTextColor(ILI9340_WHITE);
tft.setCursor(95,230);
tft.println(beats*10);if(beats*10<40) { tft.setCursor(35,270); tft.setTextColor(ILI9340_RED); tft.setTextSize(2); tft.println(“WHERE IS 911?!?”); } if((beats*10>30) && (beats*10<60)) { tft.setCursor(25,270); tft.setTextColor(ILI9340_YELLOW); tft.setTextSize(2); tft.println(“YOU’RE QUITE FIT!”); } if((beats*10>60) && (beats*10<90)) {
tft.setCursor(55,270);
tft.setTextColor(ILI9340_BLUE);
tft.setTextSize(2);
tft.println(“OH, LOOK WHO’S PERFECT…”);
}
if((beats*10<120) && (beats*10>80)) {
tft.setCursor(45,270);
tft.setTextColor(ILI9340_BLUE);
tft.setTextSize(2);
tft.println(“BEEN DOING SOME RUNNING EH?”);
}
if(beats*10>110) {
tft.setCursor(25,270);
tft.setTextColor(ILI9340_RED);
tft.setTextSize(1);
tft.println(“CUT DOWN ON THE COFFEE BUDDY!”);
}
}
Third Milestone:

For my third milestone I have modified code to display the signal that my heart rate is giving out. I started with an example code that demonstrates how to draw a line on the screen. From there I changed the delay by shortening it, and then I plotted coordinates in order for the signal to be able to be read and then displayed on my LCD. The coordinates that I picked were based on my serial output of my heart beat. The average number ended up being 565, and I made that my reference point. An arduino doesn’t know how to perfectly count a heartbeat, so I said when the line goes from below to above 565, that is the tip of a heart beat. One problem that I had was how pixelated and small my heart beat came out. To change the pixelation I made the time between points being drawn smaller and closer together. To enlarge the heartbeat on my screen I multiplied my y coordinate by 150. I have my finger sensor connected to my instrumentation amplifier which travels through my circuit. The circuit’s main purpose is to enlarge the signal that my heart gives off, because the signal is small and needs to be easily read by the arduino. This is the code I designed to perform the above.
for(int x = 0; x < 248; x++){
lastnumber= sensorValue;
sensorValue = analogRead(A0);
if ((lastnumber<565) && (sensorValue>565))
{
beats=beats+1;
}
tft.drawPixel(x,300-(100+(150.0*(sensorValue/1024.0))), PIXELCOLOR);
delay(5); // increase to make the dot move slower. Decrease to move faster
//tft.drawPixel(x,100+(75.0*(sensorValue/1024.0)), BACKCOLOR);
Serial.println(sensorValue);
delay(10);
The circuit filters out high frequencies and then amplifies the signal, sending it to my analog pin which allows my code to read the signal to my arduino as the code reads it and then the signal is displayed.
Second Milestone:
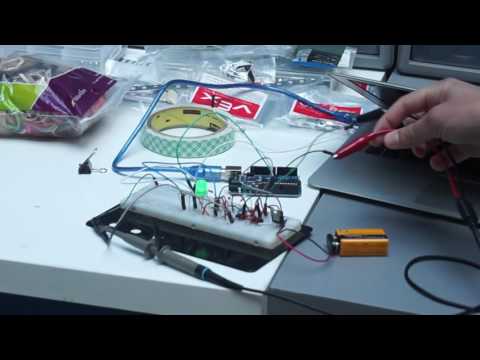
I have connected my circuit to the oscilloscope, and I am gaining a signal from the power the supply. The power running through the circuit is being supplied by a function generator. We tested the circuit’s filter by running increasing frequencies through it, and since it is a low pass filter the signals shrunk at high frequencies and were left alone at low frequencies. As we increased the range, the sound waves displayed on the oscilloscope shortened, meaning they were being filtered correctly. My next step is to input electrodes and gain a signal (heart beat), instead of inputting a voltage from the function generator.
First Milestone:


Schematic
This took me four tries to build, at least ten circuit checks, and one LED to finally light up. I was given a schematic (above) for my project and I built the circuit based off of that drawing. I started by placing my instrumentation amplifier and my operational amplifier. An amplifier is a small electronic device used for increasing amplitude, the measure of the number of the maximum value measured from position of equilibrium. The instrumentation amplifier is an amplifier that is particularly built for measurement. The operational amplifier is built mainly for circuits completing mathematical operations on an input voltage. In my case my input voltage is my BPM. The operational amplifier takes the signal from my heart beat and multiplies it to be able to be seen on the LCD. My circuit is built around the two amplifiers, but there are many other important parts. Another important part of my circuit is the voltage regulator, which is used to maintain a constant voltage within my circuit. It’s important to be able to maintain a constant voltage because you want to keep the signal more reliable. I have two capacitors which store the electric charge. Specifically in my circuit there needs to be only one sound being read, the patient’s heart beat. There is a lot of noise induced from my circuit, and the capacitors reduce that noise so that the heartbeat is easily read. I have one capacitor going to ground, which filters out unwanted high frequencies. Lastly, I have seven resistors in order to lower current flow and/or voltage levels. Another purpose for the resistors in my circuit is to set the gain, which is the number by which the signal is amplified. I got my LED to light up meaning that the signal in my circuit is flowing.
Starter Project:
For my starter project I made a voice changer. The voice changer was built on a circuit board and is powered by a 9v battery. When you turn the power on for the circuit, the current rushes through the board causing your voice to come out of the speaker at a different pitch. The four buttons cause your voice to result in four different pitches. The current needs to be controlled in order to be stable and conduct correctly, so we added capacitors, resistors, and zener diodes to the circuit board for control. We added ten resistors to reduce the voltage. Another part we added was a horizontal trimmer, which helps with the sensitivity of the microphone. The microphone was one of the hardest pieces to solder because it has polarity and you have to make sure the positioning is perfect and that the solder doesn’t bridge in order for the microphone to work. First, you speak into the microphone. The sound waves travel into the microphone and are sent to the IC (integrated circuit). On this particular circuit board there are two integrated circuits. The smaller integrated circuit has the same purpose as the larger one, but controls the electron flow for the side of the board. My largest problem when building this project was the breakage of my zener diode. This part is especially important on the board because it’s the only diode on the board. The purpose of a zener diode is to allow a large reverse voltage to flow, while a diode allows an electrical current to flow in only one direction. Originally, I reversed the polarity of my zener diode. While attempting to remove and flip my zener diode, it snapped in half. I therefore am not able to complete my starter project, because I do not have a zener diode with the same reverse voltage count as before. The rest of my project works, but since the zener diode I replaced the previous with has a lower voltage, it is allowing reverse voltages of a smaller count to pass throughout the circuit. The way I discovered that the second zener diode was allowing a smaller voltage to flow was by using a multimeter. The multimeter measures the voltage between two parts on the circuit board. When I used the multimeter to find out the voltage that the zener diode was allowing, it was one volt less than the current was flowing at in other places of the board. After researching how this circuit works I can say that I have learned how to solder, read a circuit board, and how electrons move through a circuit.