Weather Display Station with OLED Display and DHT11
My weather station displays the Humidity percentage, temperature, and heat index on an OLED screen. My modifications for this project include an LED alarm system, a reset button, and being able to show weather icons.
Engineer
Max A
Area of Interest
Mechanical Engineering
School
Regis High School
Grade
Incoming Junior
Necessary Items (Hardware/Software):
- Arduino Uno
- USB 2.0 Cable Type A/B
- OLED display
- DHT11 sensor
- Jumper wires
- Visuino Program
- Arduino IDE
Additional:
- LEDs
- 330 Ohm Resistors
- Button + Cap
Milestone Fritzing Diagrams
Update After Bluestamp
In my third milestone video, I said that I wanted to upload my temperature readings from my Arduino to the Internet using an Ethernet shield. I have managed to achieve that goal as I installed the shield on top of my Arduino and wired everything in place. The most challenging part was finding the correct code and explanation for how to connect my weather station to my Wifi network. I found out that I needed to create a port forwarding rule for my computer and add the number (12345) on to the IP address generated from my code once I opened the serial monitor after uploading the code to my Arduino.
A problem I have not yet solved out, though, is how to automatically update the temperature readings from my physical station to the website. Therefore, for now, I just take the average of the weather readings for a minute and manually enter those values into the HTML code and post that once a day. The website will also only load if I am wired to the switch that is a part of the wifi network at home.

My weather station plugged in, through the yellow Ethernet cable, to the network switch which is connected to the wifi router.
Final Milestone
For this third milestone, I have made it so that whenever the pins are unplugged from the DHT sensor, an error message (“Sensor Error”) will pop up on the OLED. This message will then disappear when the sensor is detected again, and the temperature will continue to be read. Also, using (serial.print) commands, I have added a serial monitor to my code to view the temperature values on my computer by simply clicking the button in the top-right corner of the Arduino IDE.
I have set up a reset button on my breadboard as well, and while there is one already on the Arduino, this is so that I can access everything easily on the actual station. Finally, I simplified the wiring of my station and made them cross over each other less. I realized that I was connecting to the Arduino’s three Ground pins when I could have just used one on the negative rail and linked everything from there. After the program has concluded, I hope to use an Ethernet shield to post my weather station readings on a website so other people and I don’t have to be physically next to it to check the temperature.
Second Milestone
Here are some useful links that I used while working on this milestone:
https://www.weather.gov/safety/heat-index: Explanation of heat index and how it takes humidity into account when reading temperature, also has an interesting graph about this topic
https://diyusthad.com/image2cpp: Converted my images on the first “page” of the display into bitmap HEX code that was uploadable to my Arduino
For this second milestone, I have made a new display design on the OLED with two pages of information, and can now show the heat index, a more accurate reading of the temperature as it takes the humidity into account. I have also created a LED alarm system that triggers when one of the three temperature measurements surpasses a specific value. The first page consists of the title, “Max’s Weather Station,” and the three icons from the first milestone positioned underneath it. I did this by using an online image to Arduino IDE code converter. I moved away from the Visuino software for my customizations for this milestone as it was easier to type my own code than use the somewhat confusing code generation of Visuino.
The second page has the three DHT11 readings, humidity percentage, temperature in Fahrenheit or Celsius, and heat index, along with some text. The LEDs turn on after reaching whatever threshold I gave it in the if statements in my code. There is a slight delay of around two seconds but is still generally accurate. The blue light represents the humidity, the red is for the temperature, and yellow is for the heat index. I had to connect the ground on the Arduino to the negative rail on the breadboard and linked this negative current to the negative pins of the LEDs. I also have three digital pins of the Arduino that connect to the LEDs’ positive pins through 330Ω resistors. A close-up of my station can be found in the Fritzing diagrams at the top of my page. I was initially going to have an alarm system using the icons on the first page, but after some difficulties in the coding for that idea, I moved to the LEDs. This system worked out better for me, and I think it is a more explicit version of what I had in mind. For the next couple of days, I will be trying to set up remote access to my weather station for the final milestone.
// Code will not work just on its own, need temperature variables and sensor

int ledYellow = 12;
int ledRed = 10;
int ledBlue = 8; //global variable for the pin number

//void setup
pinMode(ledYellow, OUTPUT);
pinMode(ledRed, OUTPUT);
pinMode(ledBlue, OUTPUT); // Declare the LED as an output

//void loop
if (hIndex >= 83){ // 85, 90
digitalWrite(ledYellow, HIGH);} // Turning the LED on
if (temp >= 83){ //85, 88
digitalWrite(ledRed, HIGH);}
if (hum >= 55){ //57, 65
digitalWrite(ledBlue, HIGH);}
if (hIndex < 83){
digitalWrite(ledYellow, LOW);} // Turning the LED on
if (temp < 83){
digitalWrite(ledRed, LOW);}
if (hum < 55){
digitalWrite(ledBlue, LOW);}
First Milestone
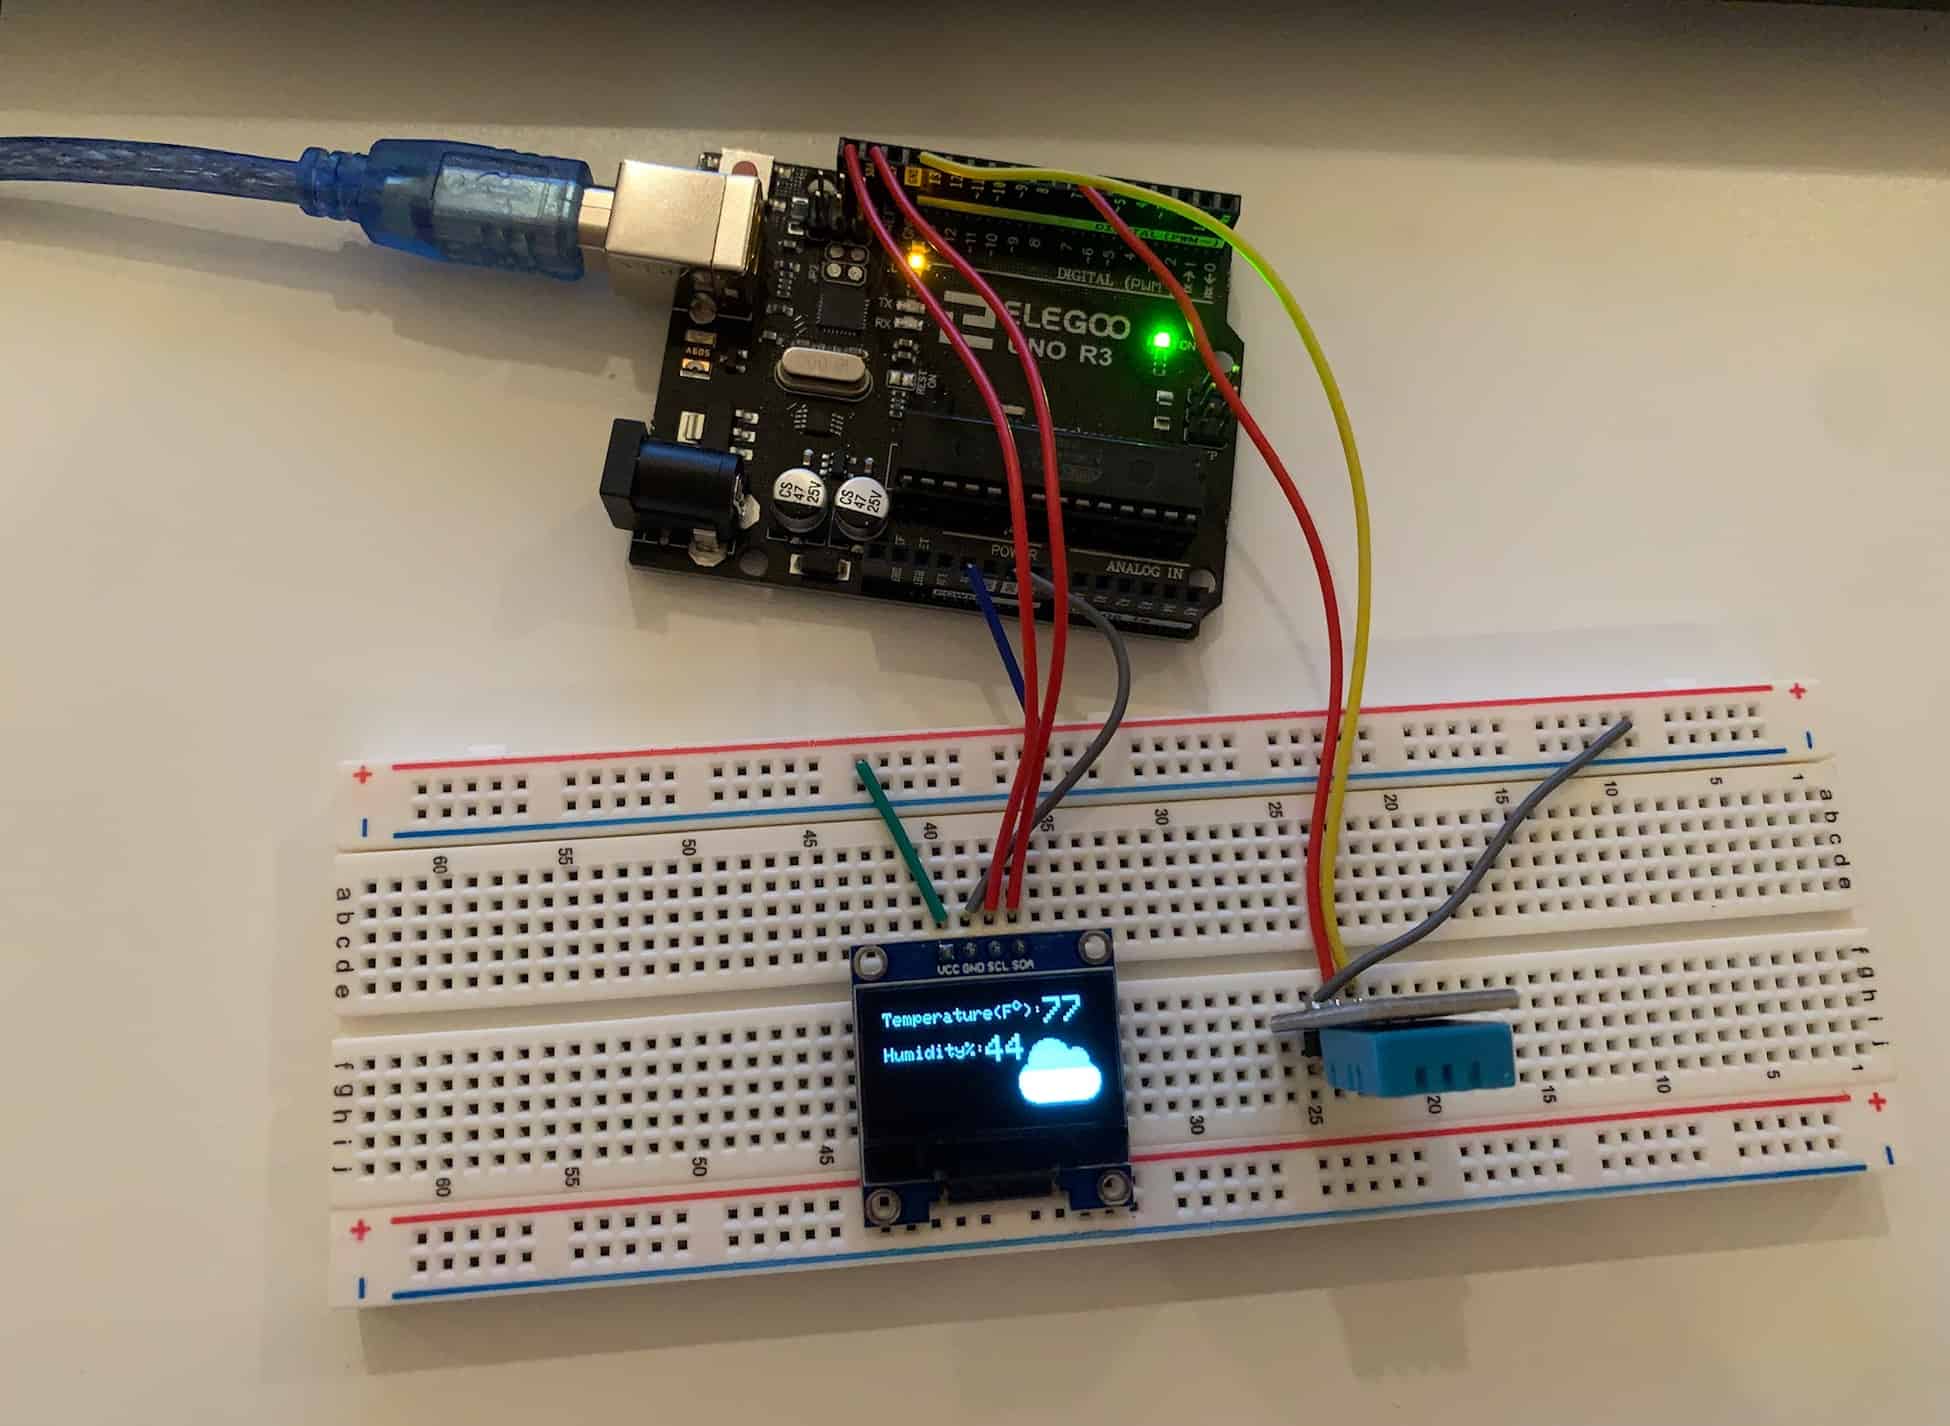
For this first milestone, I have set up my weather station after setting up the circuit both with the hardware and in the Visuino software, which allows me to produce the text and images I want on the OLED display. I inserted the OLED and DHT11 into my solderless breadboard and wired the two devices to the Arduino, which, using its microcontroller, receives the input information from the DHT and the code and outputs it onto the OLED display.
The connections from the OLED to the Arduino include SCL (Serial Clock) and SDA (Serial Data) to the identical pins on the Arduino, GND (Ground) to GND on the Arduino, and the VCC to the positive red rail on the breadboard. From the DHT11 to Arduino, I connected the negative pin to one of the GND pins, the sensor pin to digital pin 7, where the sensor will relay its readings, and the positive pin to the positive rail on the breadboard. Finally, the 5 volts pin on the Arduino goes to the positive rail to give power to everything connected on the row.
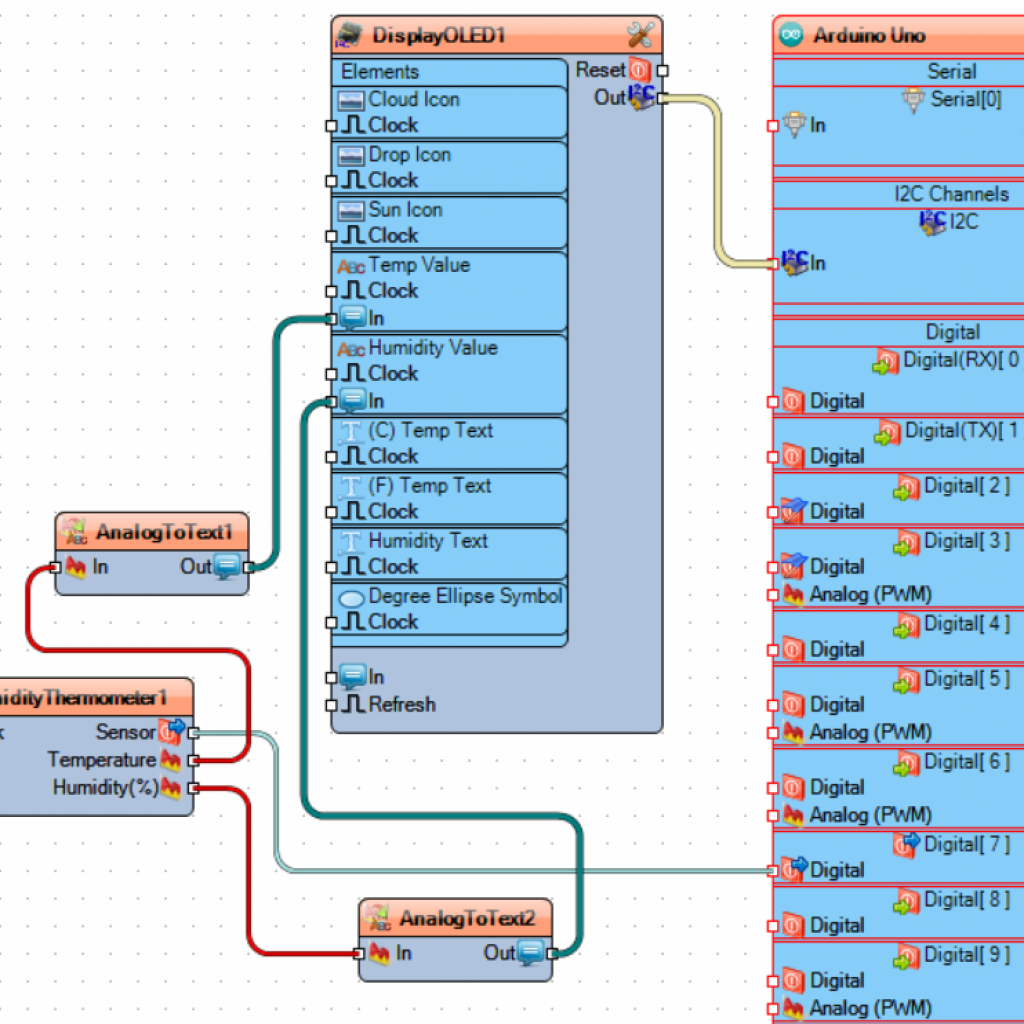
In Visuino, I replicated this design by dragging the components from the right-hand search bar. I also added two AnalogToText elements to receive the temperature and humidity readings and display them on the OLED. After the parts were connected, I loaded in three bitmap icons, a sun, raindrop, and cloud, to be displayed whenever enabled. I created a design to combine one of these images and the text by placing them on the 128×64 pixel screen. Then, I compiled the code from Visuino to the Arduino IDE, which was then uploaded to my hardware through the USB cable. I can now get readings from the DHT sensor of the temperature in both Celsius and Fahrenheit, as well as the humidity percentage in the air. I hope to develop my design further by adding more specific information, maybe in decimal points, and personally customize this project more.


