
Welcome to my page. My name is Karina, and I am a rising senior at Castilleja School. Over the past six weeks I have created an exploding star color organ and an EEG. You can read more about the exploding star color organ and the process I went through to create it at the bottom of my page.
Final Project: EEG
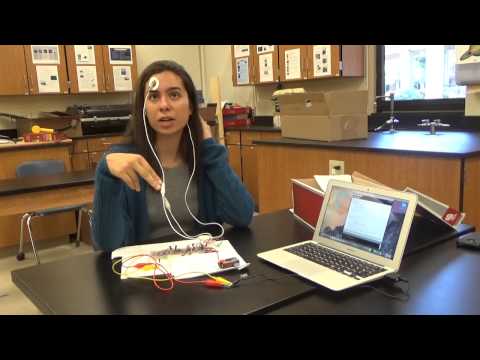
An EEG is a test that detects electrical activity across the brain. The specific EEG that I built detects alpha waves – which are waves found when one is conscious and relaxed. They are generally between 8-13 Hz, which is why the circuit I built (and the code I used) is catered to picking up a signal within that frequency. The circuit has an amplifier and various filters that are used to get rid of unwanted noise created by outside causes.
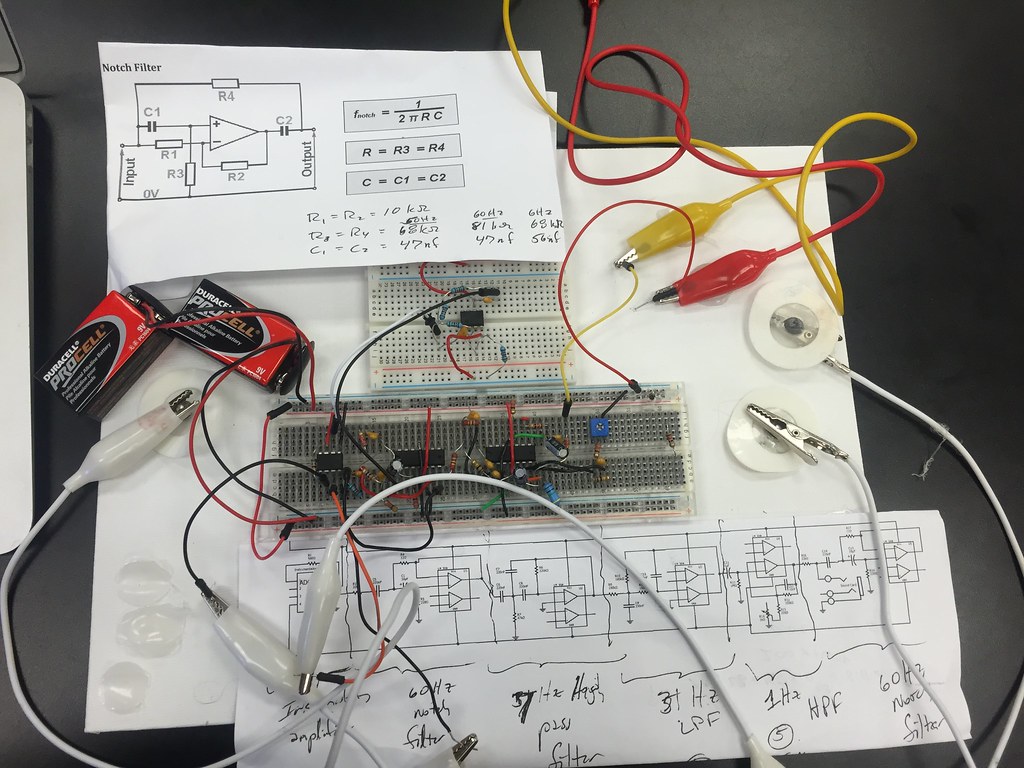
The circuit begins with an instrumentation amplifier which takes as its input 2 voltages, and outputs the difference between the two – then multiplying the difference by some gain. The instrumentation amplifier chip helps change the gain by altering the value of the resistor between pins 1 and 8 (Aside: The active electrodes are connected to pins 2 and 3 of the instrumentation amplifier chip). Next, the data is pushed through a 60 Hertz Notch Filter. We push it through a 60 Hertz filter because the biggest source of noise in this system will be at 60 Hertz (because of interference from the power line). We use this filter, as well as a couple more to cut out as much interference as we can before applying more gain.
Next, the signal is pushed through a 7 Hertz high pass filter. As we are measuring data across the skin, our final data will also contain voltage from the skin on the head of whomever is being measured. This can obscure the brain data that we want – but we can filter this out using the 7 Hertz high pass filter because the interference is mostly low frequency. This filter is a 2-pole high pass filter that has a cutoff frequency. As it is a high pass filter, frequencies above this cutoff will approach a gain of 1, while frequencies below will be continually reduced.
Next, the signal is pushed through a 31 Hertz Low Pass Filter. This allows us to filter out data above the frequencies we are interested in analyzing. Next, the data and signal pass through a 1 Hertz High Pass Filter and Gain. The beginning of this circuit contains a high pass filter with a cutoff frequency of 1 Hertz. On the other end, the resistor and capacitor in parallel provide some extra filtering of high frequencies. The potentiometer is a variable resistor which means that when the input is connected to the first pin and the output to the second, turning the wiper changes its resistance linearly from 0 to 1000 ohms. The potentiometer allows you to adjust so that such that voltages don’t go offscreen. This is because a potentiometer works like a resistor would work. By twisting the potentiometer in one direction, we get a lower resistance, while twisting it the other direction would get a higher resistance. This allows us to add just a little bit more resistance to the circuit – which keeps the frequency that we are capturing in the window that we want on the computer. Next, the data and signal are pushed through a final 60Hertz Notch Filter. Even with all the previous filtering stages, the data will still at this point contain a good amount of 60 Hertz noise. To fix this, the data this one last filter.
The reason why we use both high and low pass filter’s, is because we want to eliminate unnecessary data – there is a certain frequency that the waves we are reading are within. By filtering out frequencies above and below that we can focus on and get a clearer look at the frequency we want (this allows us to get more interpretable data).

Finally, the data goes into the computer. Using a USB stereo adapter and an auxiliary cord, I was able to transfer the signal from the circuit into the computer. Using a coding software called “Processing,” I was able to display the alpha waves that I was seeking. I could tell that it worked because when I closed my eyes, the signal would change to a different frequency – which was what was expected as the waves received should be different in a resting state. The code I used I found online – I spent a lot of time configuring the code using a debugging software called “Debug Mode – For Processing” to make sure that it ran correctly with my specific computer and circuit. The code also had some errors and so I used the debugging software to pinpoint them and alter the code.

I encountered difficulty when assembling the circuit because the diagram that showed where each piece fit into the breadboard was hard to read, and so I had to pair it with the schematic to figure out what fit where. I also had trouble with the code later on, as it was hard to find exactly what parts of it I had to alter to customize it to my computer soundboard and circuit. I also encountered difficulty inputting my data into the computer because my computer didn’t have a microphone input. I solved this problem by purchasing a USB stereo adapter. After that it was only a matter of figuring out what input that was in my computer so that I could tell the code where to read it’s information from. For a while my circuit didn’t work and so I spent a good amount of time trouble-shooting it to figure out what filter or amplifier was malfunctioning, and I eventually found that the 60 Hz Notch filter wasn’t doing it’s job correctly. To solve this I had to create a new 60 Hz Notch filter on a separate breadboard, and link it back into the circuit where the original 60 Hz Notch filter was located.
Next steps for me would be to use Arduino to monitor nodes simultaneously to observe multiple channels at the same time.
All and all I found the project to be a success – it allowed me to achieve a deeper understanding of how an EEG works and the process by which information is received and then later translated into understandable data.
Starter Project: ‘Color Organ’
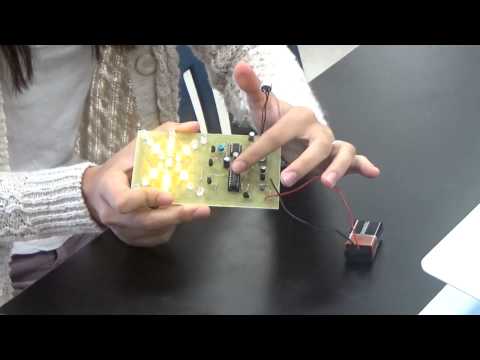
Hi, my name is Karina and I go to Castilleja School. For my starter project I decided to create an exploding star color organ. The exploding star color organ is powered by a 9V battery, and uses a microphone which lights up certain LED’s in response to the strength of the sound. The 9V battery powers the circuit, which begins by the microphone picking up the sound frequency. This signal is then sent through the first three transistors which amplify the signal. This signal is then sent to the two IC’s. In the first IC, the signal is turned into specific pulses of voltage. In the second IC, these pulses are interpreted and then directed by the IC to specific LED’s telling which one’s to light up. The 3 transistors help direct this so that specific LED’s light up. Throughout the circuit are resistors and capacitors which help regulate the voltage so that there aren’t any short-circuits. There are also potentiometers which allow for resistance throughout the circuit to be adjusted. I encountered trouble after I finished soldering because the last ring of LED’s wouldn’t light up. Because every single LED in the last ring wouldn’t light up, I assumed that I hadn’t made an error in the direction that I had positioned my LED’s (in terms of positive and negative sides) and so I first looked at the transistors to see if I had made an error in positioning those. It turned out that the error was actually a soldering malfunction – one transistor wasn’t fully soldered and so it wasn’t working properly.