Smart Garden

The Smart Garden is used to track the light, moisture, and temperature around a plant. It will also pump water if the water level is low.

Engineer

Nure S

Area of Interest

Electrical Engineering

School

Mountain View High School

Grade

Incoming Junior

Reflection: There were two main takeaways from my experience at this program. Number 1, I learned that I can do this. I had never made a project like this before, but I quickly began to see that I was making progress. My second main takeaway was to take advantage. This is for me. In so many situations we forget that the whole purpose is to benefit ourselves. Bluestamp, however, reminded me of that purpose. I am so grateful for this experience and will take with me the confidence and insight it gave me to move forward.

Final Milestone

This is my third milestone, where I added a water pump to my circuit. When the soil moisture is less than a certain percentage, the water pump will automatically run.
BJT: The main part of the circuit is the bjt. Bjt stands for bipolar junction transistor. It is called this because it is made of two types of semiconductor material. My specific bjt is an NPN bjt. N stands for negative because that layer has extra electrons, while P stands for positive because that layer had its electrons removed. There are three pins-the collector, base, and emitter. The base needs to have a higher voltage than the emitter, and the collector needs to have a higher voltage than the base. When a small current is sent to the base, the larger current from the collector is connected to the emitter.
Purpose: The purpose of the transistor is to act as a switch, controlled by current. This is useful because the transistor can be made into an open circuit or closed circuit controlled through the arduino code. The purpose of adding a bjt to my water pump circuit is to only let the water pump turn on when there is a current sent to the base pin to connect the circuit to ground.
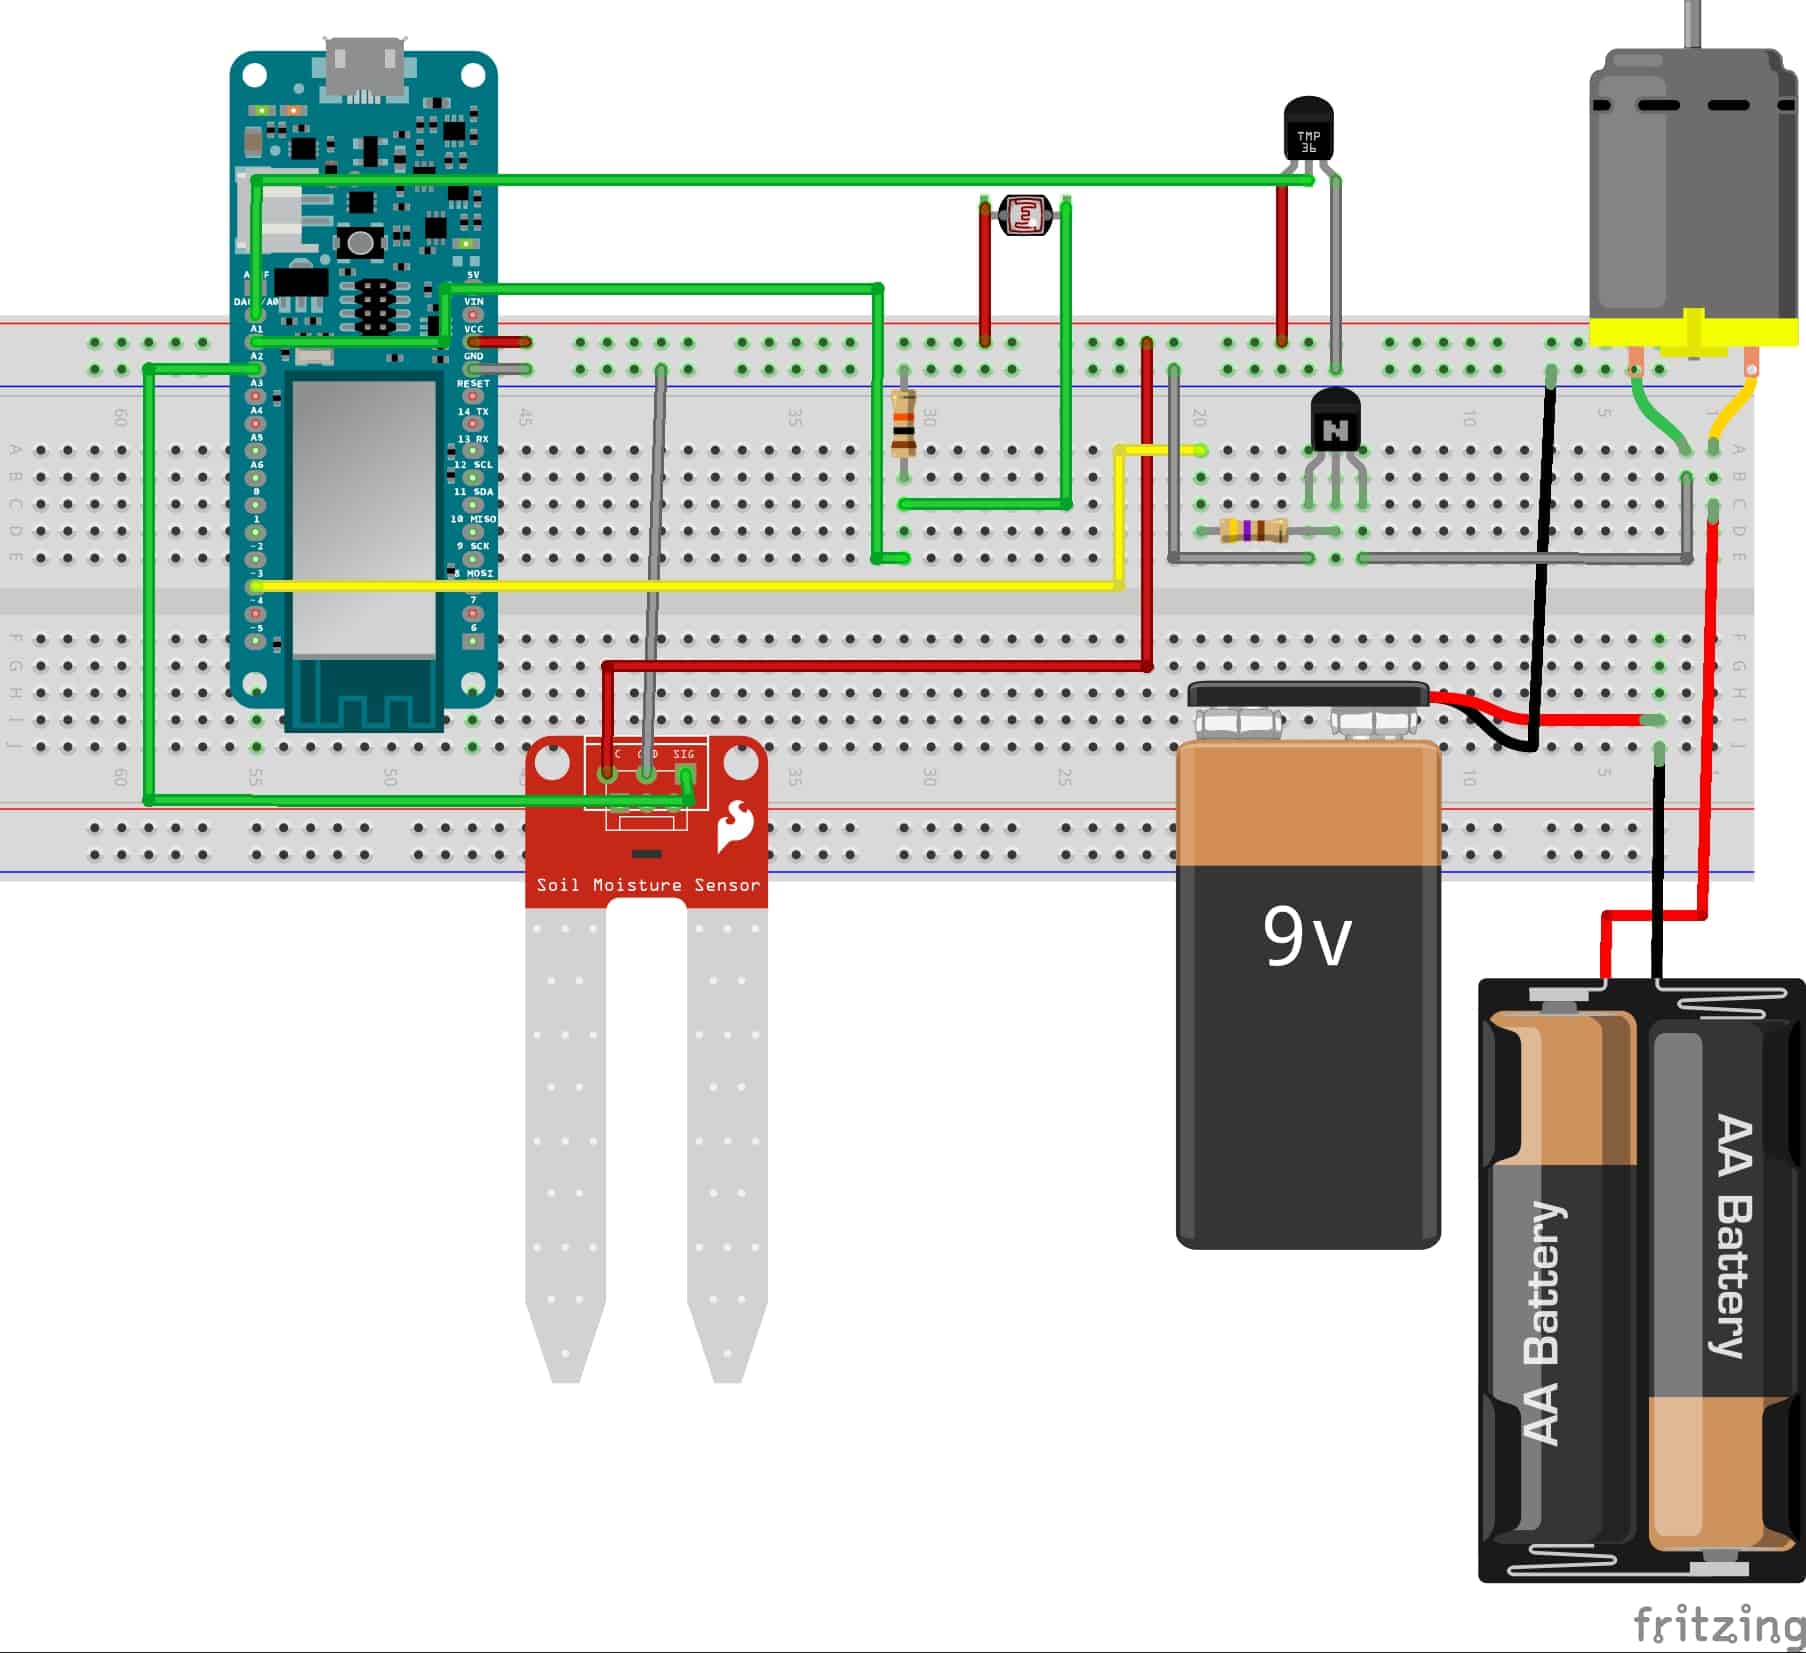
Circuit: My circuit for the water pump connects a 12 volt power supply to the motor. The motor is also connected to the collector pin, which will be connected to the emitter, which is at ground, only if a current is sent to the base. To send a current to the base, I send a voltage to a resistor that is connected to the base.

Second Milestone

This is my second milestone, where I create an app that shows my sensor data. There are two different ways information from the arduino is given to the mit app inventor. One uses ThingSpeak and the other uses a web server.
ThingSpeak: ThingSpeak is an IoT platform. Iot stands for Internet of Things, which means it connects physical devices and everyday objects to the Internet and allows them to be remotely monitored. I used ThingSpeak to hold my sensor data and create a graph. There are only a few lines of code needed, and this code is all in the arduino ide. I included the library, set up ThingSpeak in my setup function, and sent the three different sensor data. Then the ThingSpeak api automatically created a graph for each sensor.
Web Server: In addition to including a graph, I also wanted to include the current sensor values in mit app inventor. In order to do this, I had to create a web server. My specific arduino, the mkr1000, is able to connect to the wifi and create a web server. A server is a computer program or device that provides functionality for other devices, called clients. A webserver is a server that can be accessed through the internet. In this case, the arduino had the web server and the client was the mit app inventor. A lot of my problems came from writing the code for the web server correctly. The code creates a Wifi client, which lets a client connect to the arduino’s ip address- this will be the link to the web server. The code specifies that, if a client is connected, it types three pieces of data onto the screen, which will refresh every five seconds. The three pieces of data are the three sensor values.
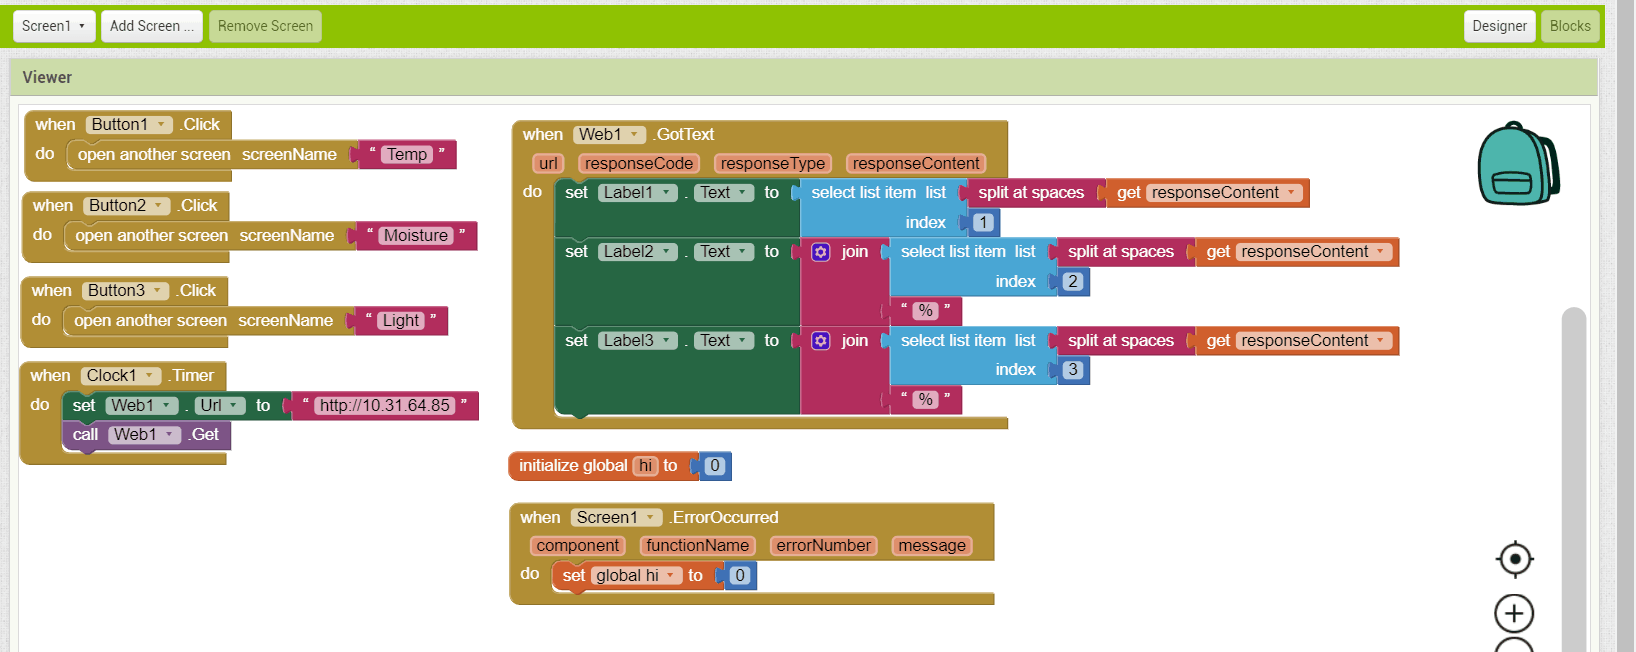
Mit App Inventor: Moving onto the mit app inventor, the code was very simple. The graphs viewed through ThingSpeak used the component called webview, which just shows the graphs when I write their specific url. The web server data is incorporated basically the same way, just with the web component instead of the webview component. This just makes the website not able to be seen by the viewer, unlike the graphs. Then I split up the three numbers on the website to write them as labels.

First Milestone

Temperature Sensor: The temperature sensor has three pins. One is connected to the power supply, one is connected to ground, one is connected to an analog pin. Inside the temperature sensor is a diode, which only allows current to go one way with a resistor of about infinite resistance in one direction and a resistor of a value of about zero in the other direction. The voltage drop across the diode varies depending on the temperature.
Soil Moisture Sensor: I am using three of the pins of the soil moisture sensor. One is connected to ground, the other to the power supply, and the other to an analog pin. The sensor has two probes, one that sends the current, and the other that receives it. The soil in between acts as a resistor. More water makes less resistance. The moisture sensor gives a number based on the resistance, so with more water, it sends a smaller number into the analog pin.
Light Sensor: The light sensor is a light dependent resistor. It is made of a semiconductor material whose resistance decreases with an increase of light. The circuit with the light dependent resistor includes two resistors in series, and sends the voltage after the light dependent resistor to the analog pin. The reason there are two resistors in series is so that the photoresistor changes the voltage and not the current. A lot of light makes the analog pin at a voltage closer to 5V, while less light makes the voltage at the analog pin closer to 0V.
Code: The code sets three analog pins as inputs. It creates percentages for the moisture and temperature by dividing the values by 1023, the max that analog pins read. The analog pin connected to the temperature sensor reads a number and then uses an equation to convert it to degrees celsius.

Code On Mit App Inventor for Final Project
screenshot-9
screenshot-10

Circuit Diagram

Circuit Diagram Smart Garden
updated_smartgarden_sensors_water_pump

Starter Project: Digital Trumpet

There are two main parts in the circuit- the buttons and the buzzer.
For the buttons, one leg is connected to ground. When the button is pressed, the two legs of the button are connected, so that both legs are at ground. This ground is connected to one of the digital pins. Digital pins detect either high or low voltage. In the code, the pins are inputs, so that the computer receives the signal of high or low. It uses the term input_pullup, which means that if there is no input, interpret it is as if it is on high. Later in the code, it says that if the pin says low, then create a tone. So, if it is not pushed, it will not create a tone. If it is pushed, the pin will be at ground, or low, which creates a tone.
The buzzer section starts with the potentiometer. A potentiometer is a variable resistor, and as the knob is turned, the voltage changes. We only use two of the legs of the potentiometer. One is connected to ground, while the other leads onto the buzzer. We know one side is at ground, and the other side’s voltage changes with the turning of the knob. This voltage leads to the buzzer, affecting its volume, as it affects the amplitude of the sound waves. The buzzer vibrates due to the electrical charge, creating sound. The buzzer is connected to pin 10. In the code, depending on which button is pressed, a different tone is sent to the buzzer, which changes the frequency, therefore the note that is played. This is because the pin is an output, and it is a digital pwm pin.
So the potentiometer affects the volume and the buttons affect the note.

STEM Summer Camps Coding & Robotics Classes For Kids San Francisco Coding & Robotics Classes For Kids New York Coding & Robotics Classes For Kids Denver Coding & Robotics Classes For Kids Palo Alto STEM Summer Camps For Kids in New York STEM Summer Camps For Kids in Palo Alto STEM Summer Camps For Kids San Francisco STEM Classes For Kids in New York STEM Classes For Kids in Palo Alto STEM Classes For Kids in San Francisco Code Classes For Kids Code Classes For Kids in New York Code Classes For Kids in Palo Alto Code Classes For Kids in San Francisco STEM Summer Camps For Kids

Leave a Comment

Start typing and press Enter to search

Bluestamp Engineering