Spectrum Analyzer for Music Production
A spectrum analyzes visualizes audio my graphing frequency on the x-axis and volume on the y-axis. I built a spectrum analyzer using a 32 x 8 LED matrix and an arduino.
Engineer
Maya R
Topics
Music, Coding

Demo Night Video
First Milestone: LED Matrix
For my first milestone, my goal was to manipulate the LED matrix. I began by setting up the hardware component–connecting the matrix and the arduino–and then worked on finding and learning to use various arduino libraries.
First Milestone Part 1: Setting up the Circuit

To Set Up the Circuit:
Power:
- Connect the 5V arduino pin to the red strip on the breadboard
- Connect the 2 power wires at the ends of the LED matrix to the red strip on the breadboard
- Plug in power source to arduino when ready
Ground:
- Connect ground pin an arduino to blue strip on breadboard
- Connect ground wires on ends of LED matrix to blue breadboard strip
Input
- Connect DIN wire on LED matrix to a resistor and then to an arduino input pin (6)
First Milestone Part 2: Learning Code to Control the Matrix with Adafruit NeoPixel
After setting up my circuit, my next objective was to learn to use the arduino libraries that would allow me to control the LEDs. The biggest challenge I encountered in doing this was finding the initalization for my specific matrix, WS2812b.
Using the Adafruit Neopixel Library:
The first library I learned to use was the Adafruit NeoPixel library.
The initialization code:
#include <Adafruit_NeoPixel.h>
#define PIN 6
Adafruit_NeoPixel strip=Adafruit_NeoPixel(256, PIN, NEO_GRB + NEO_KHZ800);
void setup(){
strip.begin();
strip.setBrightness(10);
strip.show();
}
Here is a link to Adafruit’s NeoPixel guide: https://learn.adafruit.com/adafruit-neopixel-uberguide/arduino-library-use
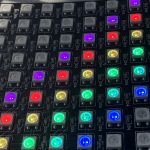
Here is a program I was able to build with the NeoPixel library
First Milestone Part 3: Using Adafruit NeoMatrix and GFX
NeoPixel controlled the matrix by using the number assigned to individual LEDs. My LED matrix assigns the number in a zigzag pattern. Spectrum analyzers, however, graph volume as a function of frequency, so I wanted to use libraries that treat the matrix as an x/y grid.
To initialize with Adafruit NeoMatrix and GFX:
#include <Adafruit_NeoMatrix.h>
#include <Adafruit_GFX.h>
#include <Adafruit_NeoPixel.h>
#define PIN 6
Adafruit_NeoMatrix matrix = Adafruit_NeoMatrix(32, 8, PIN,
NEO_MATRIX_BOTTOM + NEO_MATRIX_LEFT +
NEO_MATRIX_COLUMNS + NEO_MATRIX_ZIGZAG,
NEO_GRB + NEO_KHZ800);
void setup(){
matrix.begin();
matrix.setBrightness(10);
matrix.show();
}
Some helpful references for Adafruit GFX
https://learn.adafruit.com/adafruit-gfx-graphics-library
http://adafruit.github.io/Adafruit-GFX-Library/html/class_adafruit___g_f_x.html#a1cffbb1d69c5faf49cd0cff27686a837

Obstacle: Color with GFX/NeoMatrix
NeoPixel uses 32-byte colors, which allows use of hexadecimal color codes. However, GFX uses 16-byte colors for which codes are less intuitive. Initially this was a challenge, but eventually I found a method that converts hexadecimal colors to 16-byte colors. I also added 16-byte definitions for basic colors that I copied from the Adafruit website to my initialization routine.
uint16_t Adafruit_NeoMatrix::Color(uint8_t r, uint8_t g, uint8_t b) {
return ((uint16_t)(r & 0xF8) << 8) | ((uint16_t)(g & 0xFC) << 3) | (b >> 3);
}
uint16_t turq = Adafruit_NeoMatrix::Color(0, 150, 150);
#define BLACK 0x0000
#define BLUE 0x001F
#define RED 0xF800
#define GREEN 0x07E0
#define CYAN 0x07FF
#define MAGENTA 0xF81F
#define YELLOW 0xFFE0
#define WHITE 0xFFFF
Second Milestone: Analyzing Sound
For my second milestone, I used libraries to analyze sound in Processing and sent the data to the Arduino to display it on the LED matrix.
Second Milestone Part 1: Connecting Processing and Arduino
Helpful Website:
https://learn.sparkfun.com/tutorials/connecting-arduino-to-processing/all
void setup(){
//initialize serial communications and set baud rate
Serial.begin(115200);
}
…
void draw(){
int val;
if (Serial.available()) {
val = Serial.read();
import processing.serial.*; //import the serial library
Serial myPort; // Create object from Serial class
void setup(){
size(200, 200);
String portName=Serial.list()[1];
myPort = new Serial(this, portName , 115200);
}
….
void draw(){
myPort.write();
Processing Sound Library
At first, I familiarized myself with the Processing Sound Library’s FFT function. An FFT, or fast fourier transform, is a mathematical method for analyzing audio input. The Sound Library’s FFT created “bins” with the data; the FFT ran repeatedly, and each time it ran in created an array in which the position of a number corresponded to a certain range of frequencies and the number itself indicated the volume or amplitude of that frequency range.
I used example code online to find the initialization and methods required to implement the FFT. However, the example code would play a specified file and create the spectrum analysis graph in the Processing draw window. I wanted the spectrum analyzer to take in audio input in real time from my computer’s microphone and graph it on the LED matrix.
Sending the data from Processing to Arduino to be graphed on the matrix was really difficult.