Injury Preventing Smart Shoe
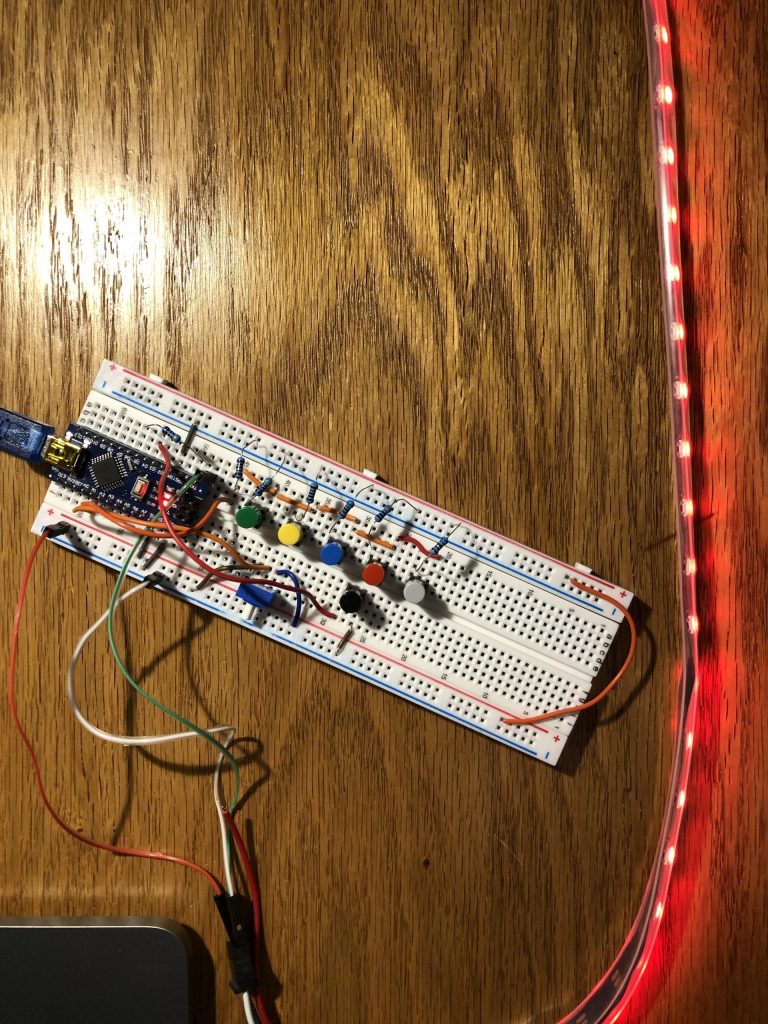
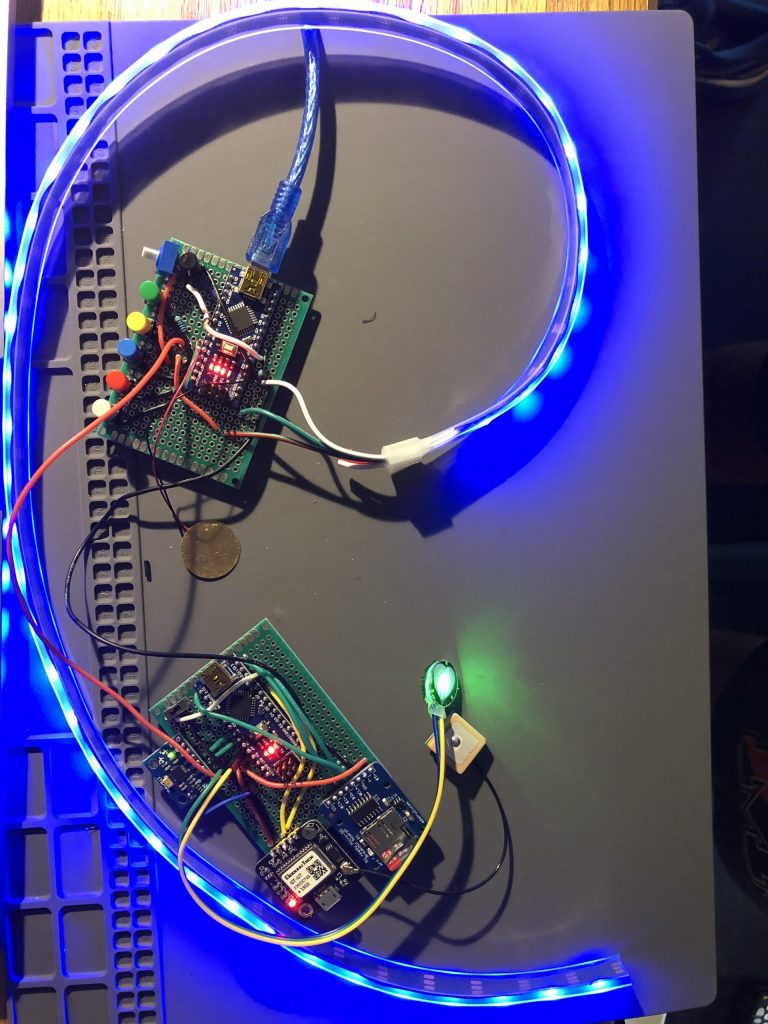
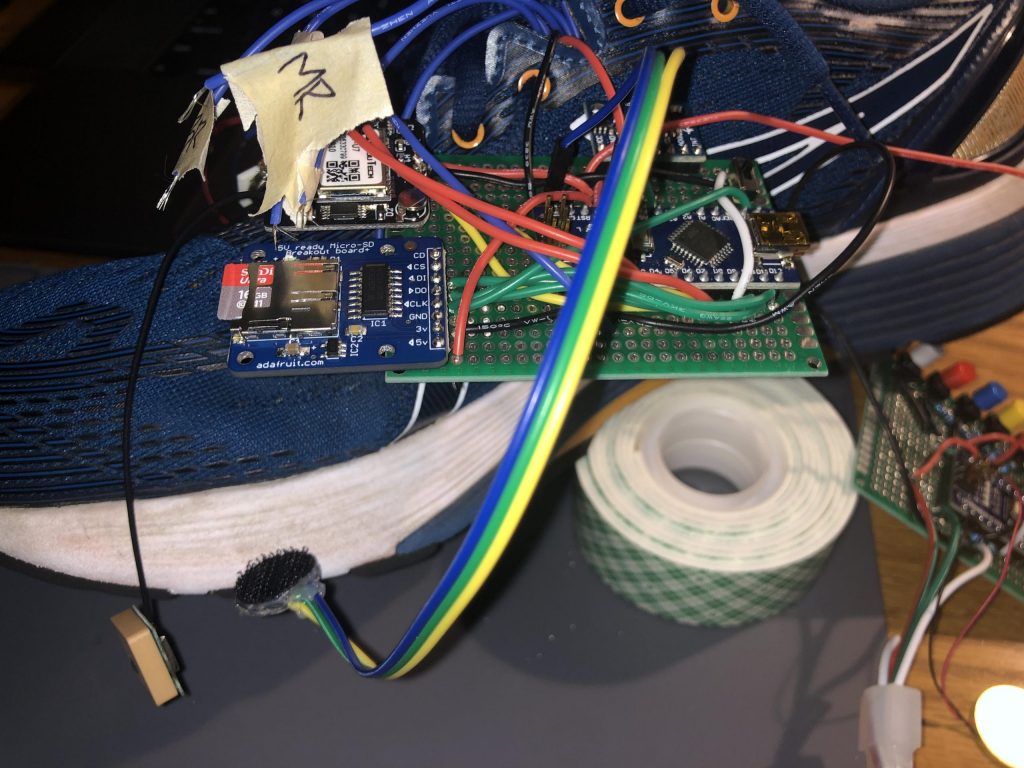
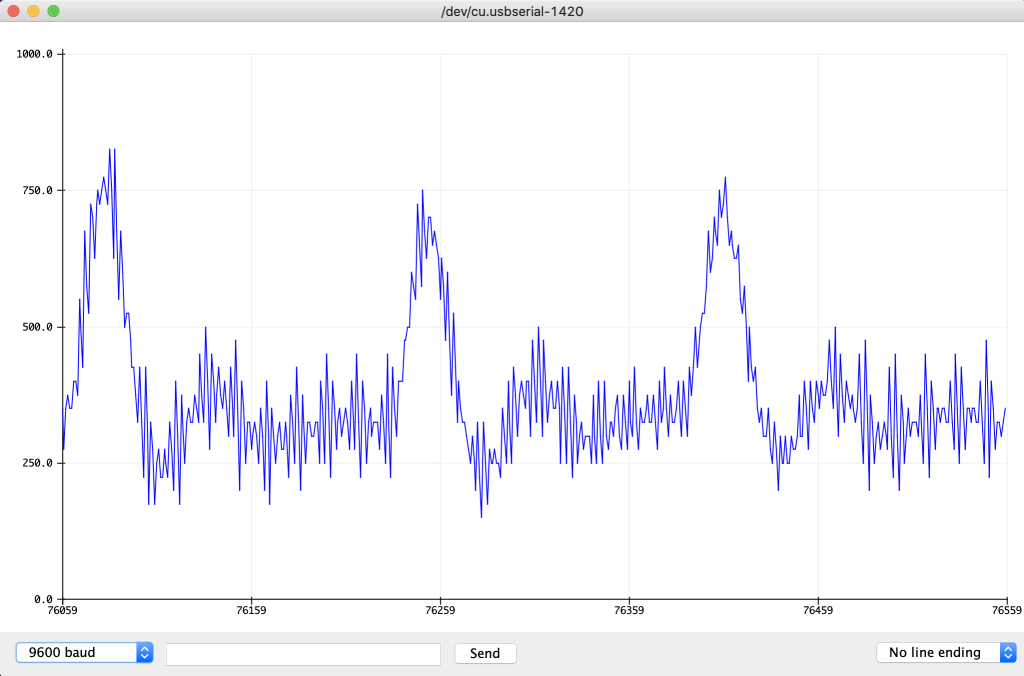
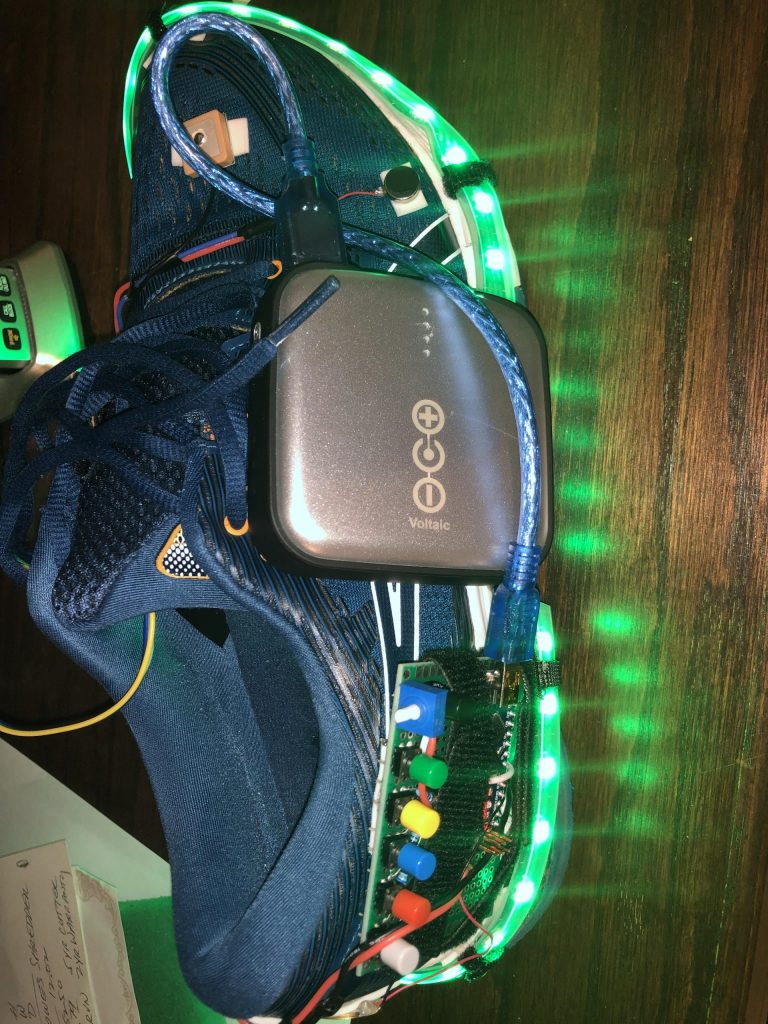
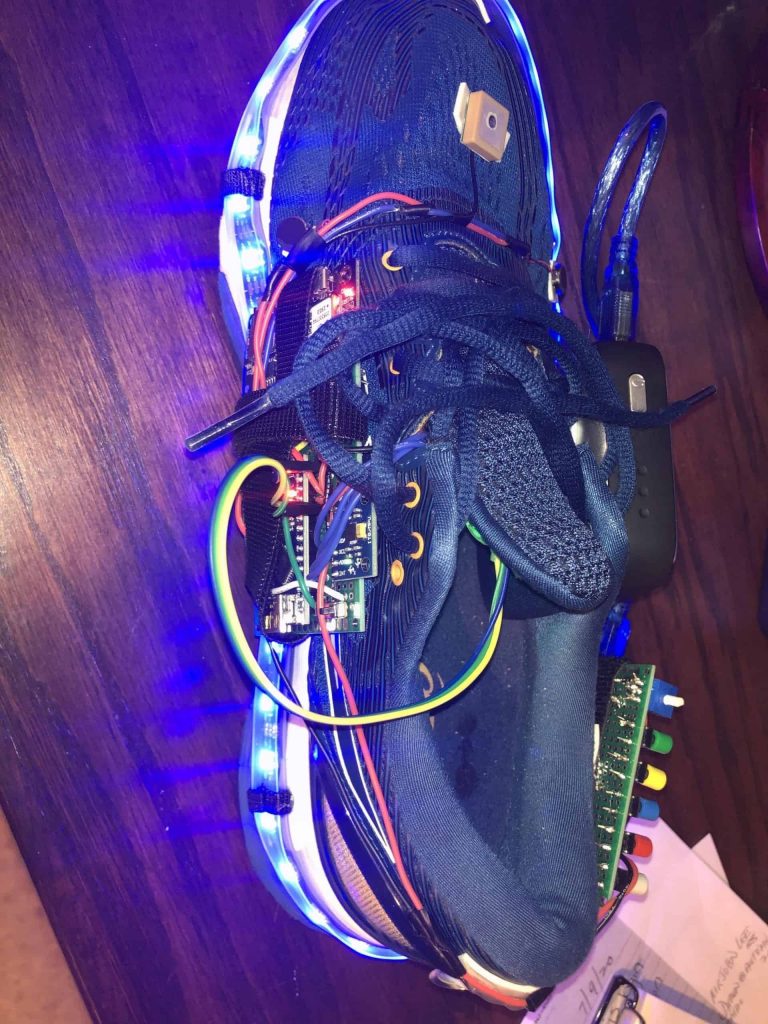
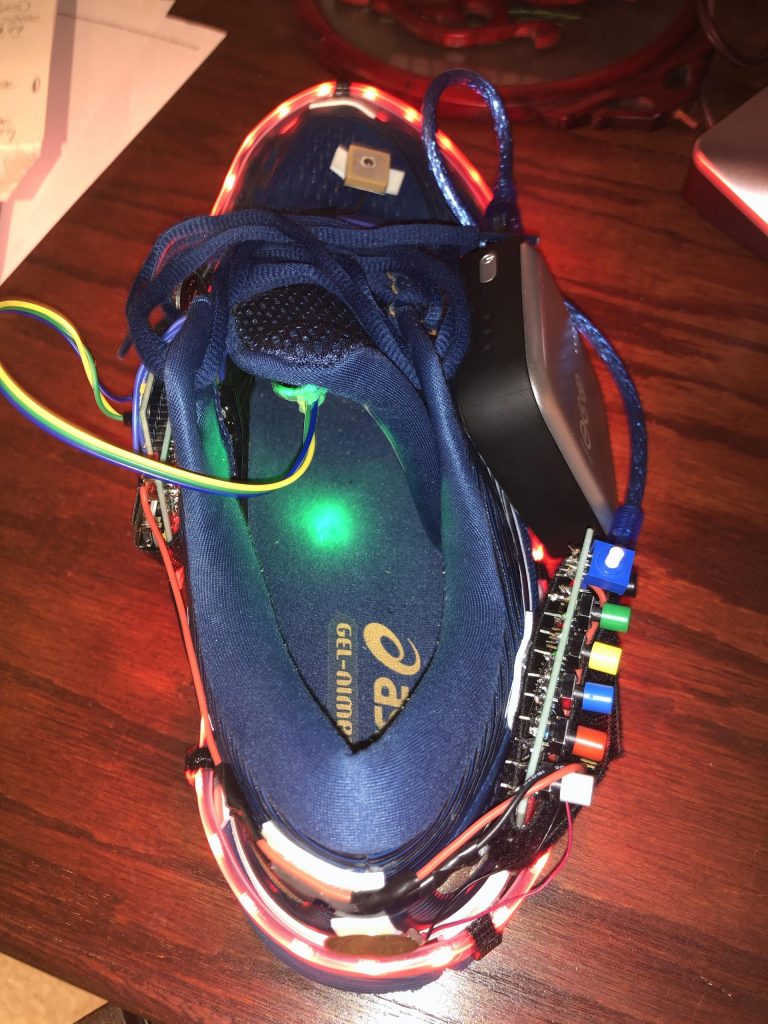
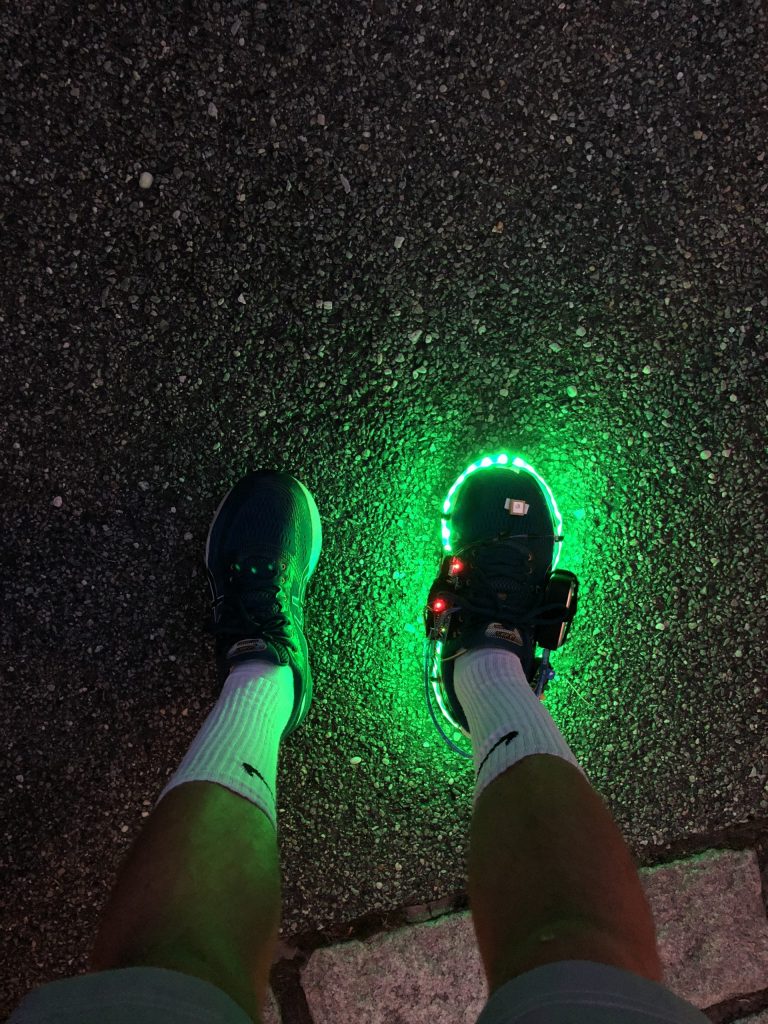
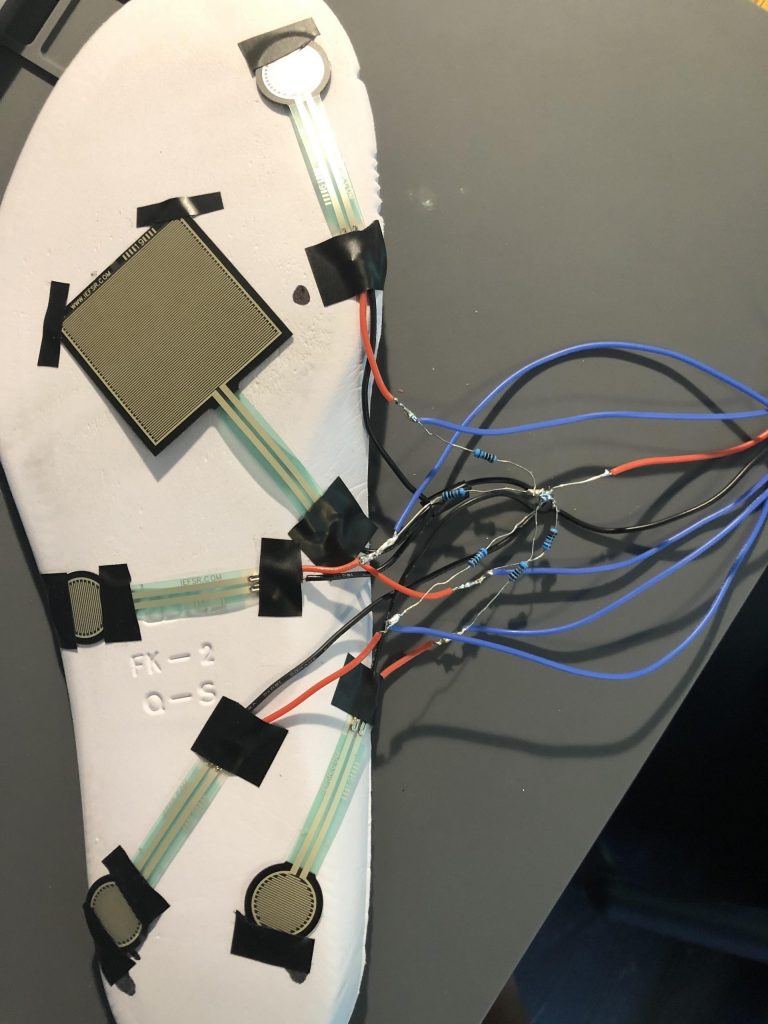
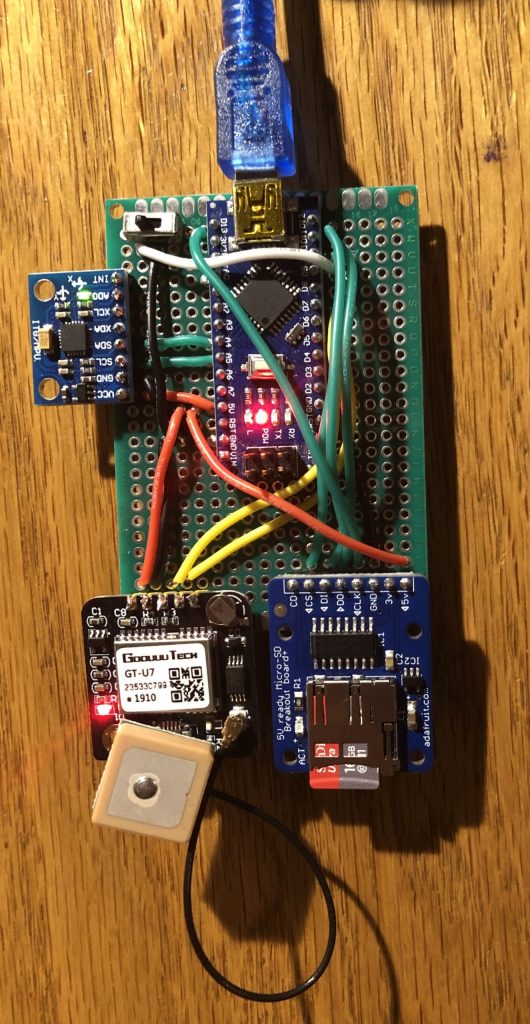
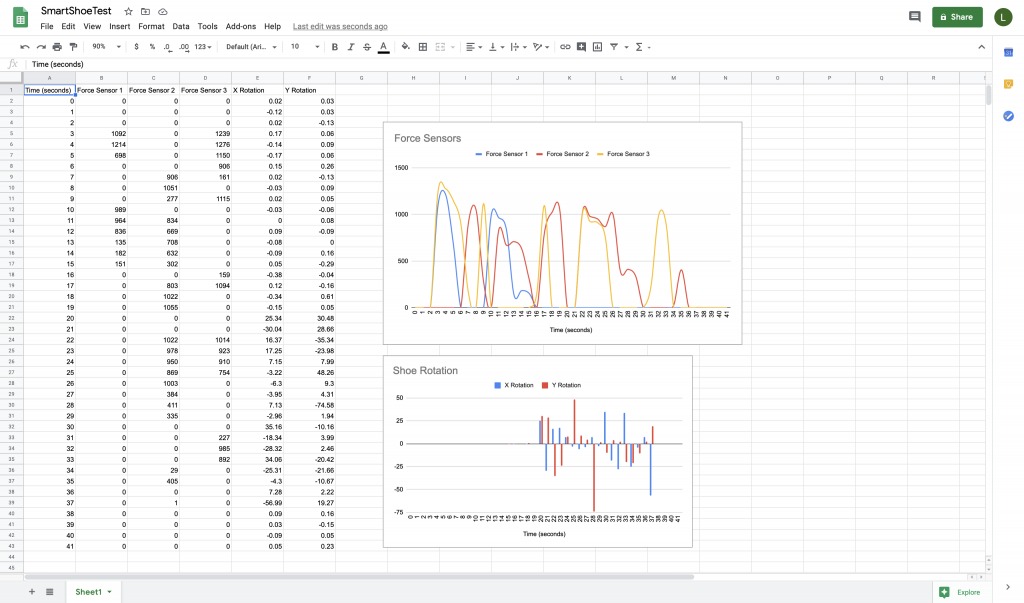
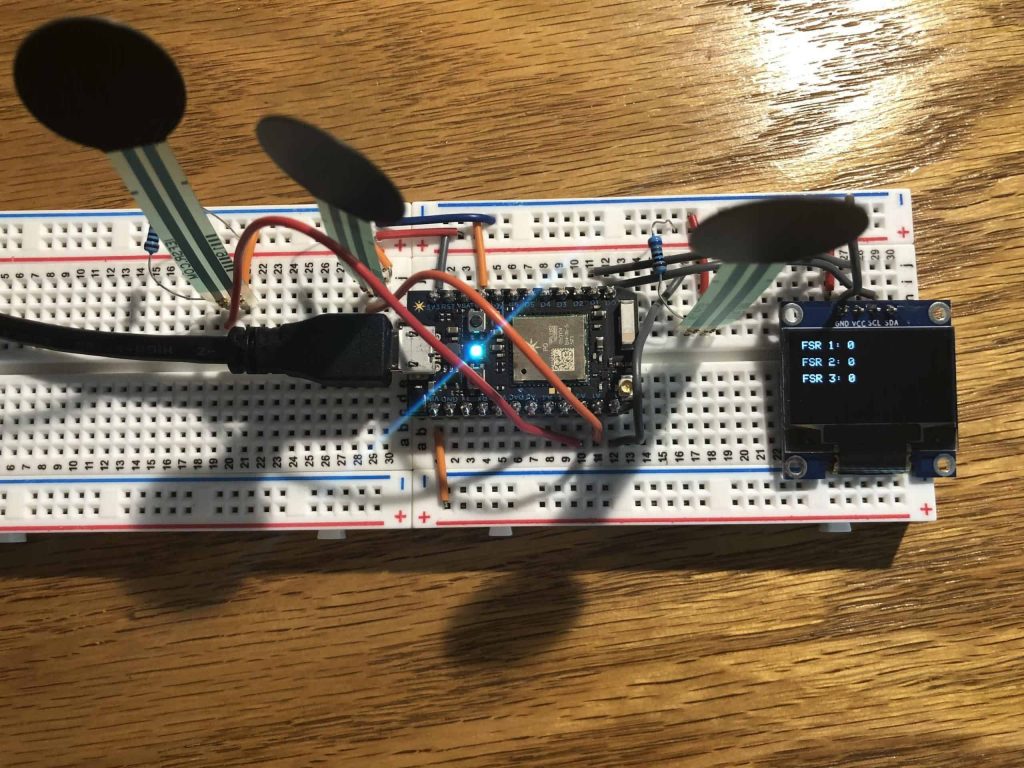
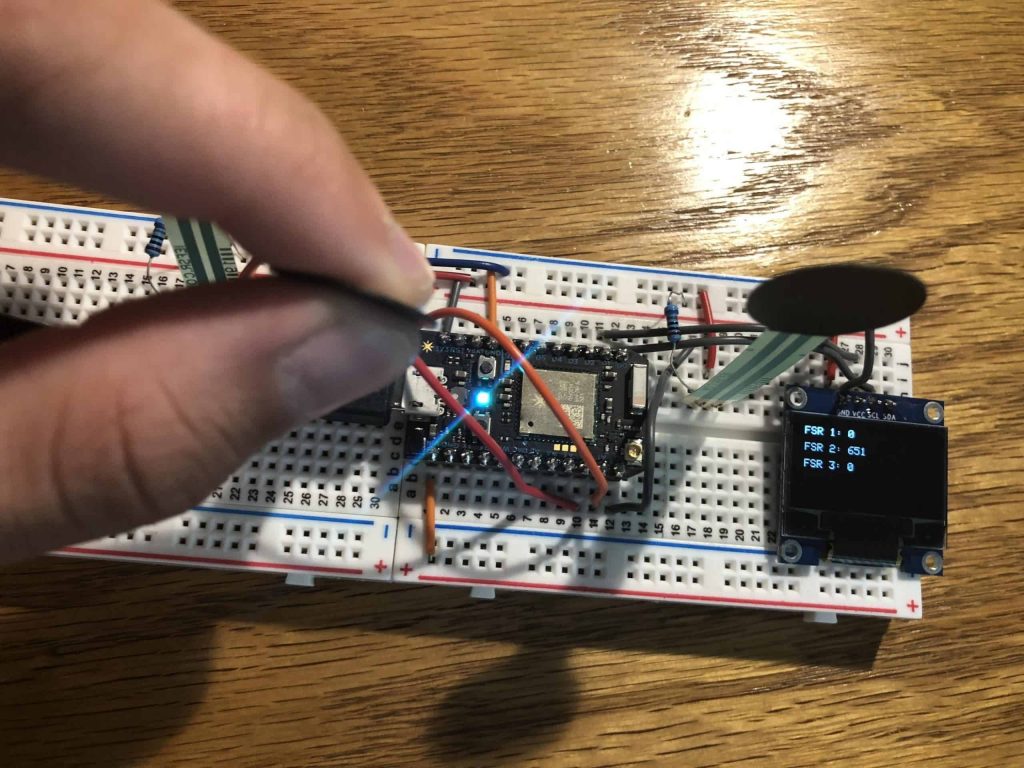
This shoe detects poor pronation to prevent injuries and provides useful biometric data, including heart rate and distance. It also has a navigation function, eliminating the need to check a phone. Finally, it has a bright LED strip that lights up how and when the wearer wants.
Engineer
Lucas M
Area of Interest
Mechanical Engineering
School
Manhasset High School
Grade
Incoming Senior
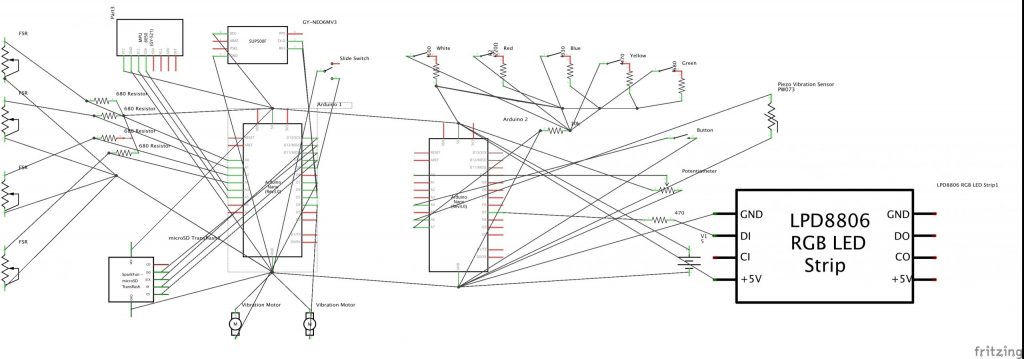
Links and Schematic
Demo and Reflection
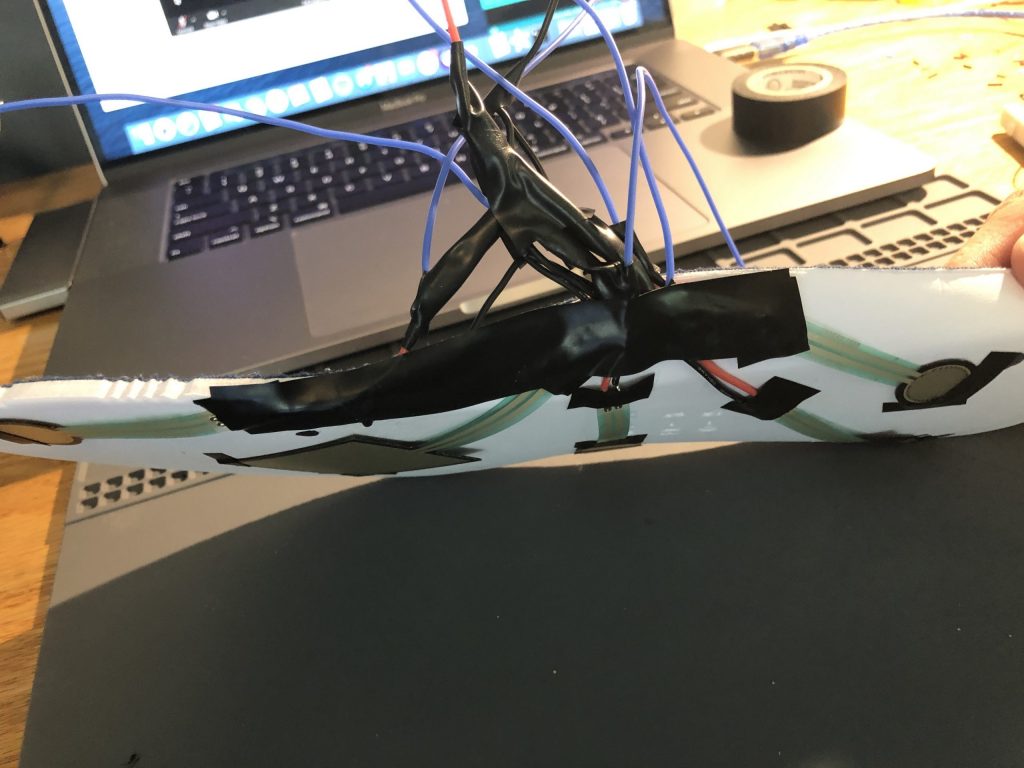
Although I had some basic experience in Arduino and programming before this program, I did not truly know what it meant to be an engineer. While I still may not comprehend it completely, I feel like I understand the engineering process and thinking much better. I also learned a lot about independent learning/research, getting used to sifting through forums and appreciating all the documentation already available from the engineering community. Additionally, I finally understand how engineering is not always simply straightforward numbers or right and wrong. All my previous experience with STEM classes had led me to believe that almost everything is black and white, with not much room for creativity or thinking outside the box. Here, though, I had to do quite a bit of that with my project, whether fitting and attaching components to my shoe in creative ways or figuring out new ways to debug/approach a problem. Finally, I am less resistant to failure or spending a lot of time on seemingly small bugs (while making sure not to neglect other parts of the project), as I recognize the value in these processes. This experience definitely strengthened my interest engineering, and I’m excited to use what I learned here in the future.