Weather Data Display
The Weather Data Display is a device that uses a Raspberry Pi microcontroller to gather weather data from several weather websites and display the information on an LED screen.
Engineer
Christopher K
Area of Interest
Computer Science
School
Mills High School
Grade
Incoming Senior
Reflection
Demo Night
Final Milestone
Third Milestone
For my third milestone, I added new features to my Weather Data Display in an attempt to make it more user friendly.
My first modification was adding a button that switches the location of the display. I started this by adding a line in the help page to displays the city name and the zip code number. Next, I created a basic circuit for a button* and connected it to the Raspberry Pi through the GPIO pins.
If you don’t know how to wire a button to the Raspberry Pi, it is actually a very simple process. All that you need is a breadboard, two male-female jumper cables and a four-pinned button.
Start building the circuit by snapping the button in place along the center ravine of the breadboard with two pins on one side and two on the other. This is to make sure that you don’t connect all four pins and short circuit the button. Next, connect the male head of a jumper cable to a pin-hole on the same row as one of the button pins and connect the female head to a GND pin on the Raspberry Pi GPIO – you may need to look up a diagram of the GPIO pins for your specific version of the Raspberry Pi. Lastly, connect another jumper cable from the other button pin on the same side of the ravine to any numbered pin on the GPIO. This completes the circuit from the Raspberry Pi to the button back to the Raspberry Pi. Make sure that you remember the GPIO pin number that you connected the button to because this is the number that you will use to access it in your code.
You can test your button by running this simple program on your Raspberry Pi. Make sure that you change the pinNum to the GPIO pin number that you connected your button to.
I then created an array of four zip codes and programmed the button so that, when the it is pressed, the index variable of that array increases by one, switching the displayed location of the weather data and prompting the display to update its weather information. An array is essentially an ordered list of objects and the index is the position on that list.
I later also added a button that switches the mode of the display when pressed, so that the user does not need a keyboard to switch the display mode. The original creator of this project already wrote a function to switch the display mode, so I just rewrote part of it to fit my needs.
*For a more complete tutorial on how to wire a button, click here.

Second Milestone
For my second milestone, I built the enclosure for my display. As you can see, it has four main parts to it: a frame to hold the screen, a panel to hold any buttons or switches that you may decide to add to your display, and two side pieces to hold the structure together. I also added a fifth piece in the back just for extra support. I wanted to create a display similar to an arcade game, mainly because it is a practical design to hold all of my components. I also included an opening between the screen frame and the button panel so that the wires could easily connect the GPIO pins at the back of the Raspberry Pi.
I took several days to design and construct this enclosure. I chose to use acrylic plexiglass for mine but at the time, I didn’t realize how difficult and time-consuming cutting it actually would be. Looking back, using a different material could have made the building process much easier. In order to cut plexiglass you need to use a exacto knife or an acrylic scoring knife in order to score a deep line and break the sheet of acrylic along that line. If you are looking to recreate this project, I would suggest using a different material such as wood – wood is sturdy, easy to cut, and overall a much cleaner alternative to cut than acrylic. I would suggest, though, that you design your own enclosure so that it’s more personal.
I also had a few other setbacks when making this enclosure. When I was breaking a piece of acrylic, it broke along the wrong line – to fix this, I had to superglue the piece back in place. Another issue was cutting out the middle hole in the frame piece. Since the scoring and breaking method would not work for this piece, we used a drill to cut out along the inner edge of the frame. Also, while I was gluing the frame piece to the two support pieces, I pressed down to hard on the display screen, partially breaking it. My advice would be to build the enclosure first before adding on the Raspberry Pi since the screen is so fragile.
Enclosure/Case
First Milestone
For my main project, I chose to build the Weather Data Display. This project uses a Raspberry Pi and an LCD Display to display current weather taken from weather.com.
I started this project by connecting the Display and the Pi using a ribbon cable and setting up the Pi’s operating system – for this project, I used the default OS Raspbian. I then downloaded the necessary modules for the project and ran the program. The code has two primary files – one titled pywapi.py and the other titled weather.py. Pywapi.py contains a function that accesses weather.com’s data page and returns a dictionary that holds information current and upcoming weather conditions.
The other file, weather.py, contains the main program that runs the functions and displays the graphics on the screen. It uses a module called pygame in order to set up the GUI – or graphical user interface – and print strings onto the screen using the blit function. The program creates a class called smScreen which sets up a new screen in pygame and initializes class variables, such as the screen’s dimensions. It then runs an infinite loop which continuously checks for the current mode, which can be changed by pressing the ‘w’, ‘c’, or ‘h’ keys on the keyboard. By pressing ‘w’, the display goes into “weather” mode, in which it displays current conditions and forecasts for the next dew days. ‘C’ brings the display into calendar mode, which prints out the calendar for the current month. ‘H’ is help mode, which displays a basic overview of the weather and other information such as “Time until Sunset” and “Visibility.”
Some issues that I had to work through when setting up the display were reorganizing the messy source code and rewriting the calendar code. I removed pieces of repeated code and instead defined them as a separate function; I also took out parts that weren’t needed for my project. The original program’s calendar would not print correctly, so I wrote a new program using a different method.
Calendar before and after
def drawBorder(self):
# Fill the screen with black
self.screen.fill( (0,0,0) )
# Draw Screen Border
pygame.draw.line( self.screen, lc, (xmin,ymin),(xmax,ymin), lines )
pygame.draw.line( self.screen, lc, (xmin,ymin),(xmin,ymax), lines )
pygame.draw.line( self.screen, lc, (xmin,ymax),(xmax,ymax), lines ) # Bottom
pygame.draw.line( self.screen, lc, (xmax,ymin),(xmax,ymax), lines )
pygame.draw.line( self.screen, lc, (xmin,ymax*0.15),(xmax,ymax*0.15), lines )
# Time & Date
th = self.tmdateTh
sh = self.tmdateSmTh
#font = pygame.font.SysFont( fn, int(ymax*th), bold=1 ) # Regular Font
#sfont = pygame.font.SysFont( fn, int(ymax*sh), bold=1 ) # Small Font for Seconds
tm1 = time.strftime( “%a, %b %d %I:%M”, time.localtime() ) # 1st part
tm2 = time.strftime( “%S”, time.localtime() ) # 2nd
tm3 = time.strftime( ” %P”, time.localtime() ) #
rtm1 = self.font.render( tm1, True, lc )
(tx1,ty1) = rtm1.get_size()
rtm2 = self.sfont.render( tm2, True, lc )
(tx2,ty2) = rtm2.get_size()
rtm3 = self.font.render( tm3, True, lc )
(tx3,ty3) = rtm3.get_size()
tp = xmax / 2 – (tx1 + tx2 + tx3) / 2
self.screen.blit( rtm1, (tp,self.tmdateYPos) )
self.screen.blit( rtm2, (tp+tx1+3,self.tmdateYPosSm) )
self.screen.blit( rtm3, (tp+tx1+tx2,self.tmdateYPos) )
Keep in mind that this code is not spaced properly.
def disp_calendar(self):
self.drawBorder()
#Conditions
yStart = 0.20 # Yaxis Start Pos
xStart = 0.20 # Xaxis Start Pos
spacing = .6/7 # Line Spacing Gap
xDif = xmax – xmin
yDif = ymax – ymin
yr = int( time.strftime( “%Y”, time.localtime() ) ) # Get Year
mn = int( time.strftime( “%m”, time.localtime() ) ) # Get Month
calendar.setfirstweekday(6) #set Sunday as first in the week
cal = calendar.monthcalendar(yr,mn) #make cal into matrix
mn_name = calendar.month_name[mn]
calDate = “%s %s” %(mn_name,yr)
txt = self.sfont.render(calDate, True, lc)
(tx, ty) = txt.get_size()
self.screen.blit(txt, ( (xmax)/2 – tx/2,
ymin+yDif*(.17)))
days = [‘S’, ‘M’, ‘T’, ‘W’, ‘T’, ‘F’, ‘S’]
for d in range(0, 7):
txt = self.sfont.render(days[d], True, lc)
self.screen.blit(txt, ( xmin+xDif*(xStart + spacing*d),
ymin+yDif*(yStart+spacing)))
for r in range(0,len(cal)):
for c in range(0, 7):
if (cal[r][c] != 0):
txt = self.sfont.render(str(cal[r][c]), True, lc)
self.screen.blit(txt, ( xmin+xDif*(xStart + spacing*c),
ymin+yDif*(yStart+spacing*(r+2))))
# Update the display
pygame.display.update()
Keep in mind that this code is not spaced properly.
Click here to view the instructions for the project.
Click here to view my edited version of weather.py
Starter Project – Electronic Die
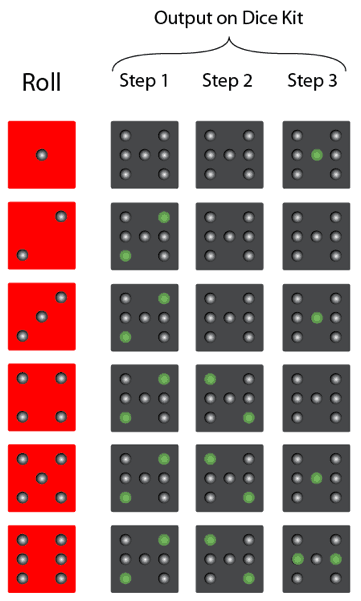
The Electronic Die is a device that, when shaken, generates a random number between 1 and 6 and displays it through the 7 LED lights on the top.
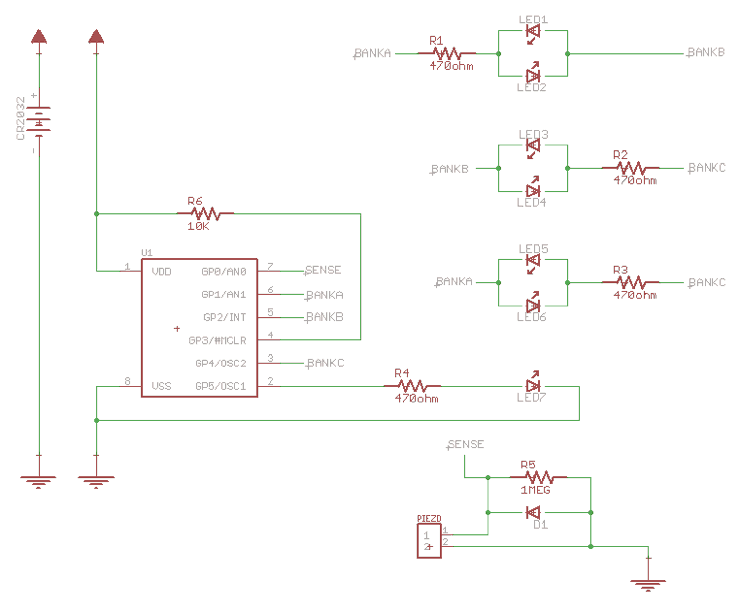
When the piezoelectric sensor on the acrylic mount senses a disturbance (like a tap) it sends an analog value, in the form of a voltage, to the PIC microcontroller, which converts that into a 10-digit binary number. The PIC then takes the last three bits of that number – which would give a value from 0 to 7 – and shifts the number to the left, resulting in a value from 0 to 6. If a 0 is rolled the PIC microcontroller “rerolls” it until the resulting value is between 1 and 6. Then, depending on the number, the microcontroller turns on up to 3 sets of LED pairs in order to represent the number in “die format.” Through a clever wiring pattern, all six possible outcomes can be displayed using a three step combination of the four patterns.
Some difficulties I encountered when assembling this project were attaching the PIC microcontroller and the battery holder to the circuit board. This microcontroller was a very troublesome part to attach because of its small size – in order to attach the first leg, I had to hold it with my right hand while soldering in order to ensure that it didn’t fall out. Looking back, I could have used tape to keep it attached while I soldered. The battery holder, on the other hand, was difficult to attach because of its large, bulky structure – it was difficult to keep the piece still while soldering. In the end, I attached it by placing it face down on the table, balancing the circuit board on top, and carefully soldering it down. I later discovered that I had also mistakenly switched the 10k and the 1 M ohm resistors, which caused the die to randomly flash. If you are also building this project, make sure that you double check what you are attaching before you solder it on!
Click here to learn more about the electronic die.


Pictures from spikenzielabs.com


