BITalino ECG Data Analyzer
BITalino Revolution Kit is a wearable toolkit with many sensors to track data for various parts of the body such as the muscles, heart, nervous system, and the brain. The heart sensor is used for my ECG data analysis.
Engineer
Sneha S
Area of Interest
Biomedical Engineering
School
Cupertino High School
Grade
Incoming Junior
REFLECTION
Hi, my name is Sneha, I am a rising junior at Cupertino High School and my main project is the BITalino ECG Data Analyzer. BITalino is a hardware and software toolkit used to measure electrical activity in the skin, muscle, brain, and heart. However, my ECG data analysis only focuses on the heart. I chose this project to see how technology impacts the medical field. I thought it would be interesting to work with a simple wearable device that monitors and collects data in real time.
My greatest struggle with this project was coding in Python since I did not have much software experience. When starting my second milestone, I tried to use the program EEGrunt to do data analysis with my heart and brain sensors but it did not work with my BITalino kit. Instead, I wrote my own code to find a specific data file, create a graph, and calculate heart rate.
Overall, I learned a lot from my time at Bluestamp Engineering. First, I learned more about Python from encountering many software errors and writing the commands needed for my code in order to analyze heart rate. In addition, this experience inspired me to do more medical related projects. In the future, I plan to expand on my data analysis for each of the sensors.
Here is my Bill of Materials: https://docs.google.com/spreadsheets/d/1vrC-oA8gRZUCyN-Yl7pno4qXU-xRkvKnAAxuaPW7vNg/edit?usp=sharing
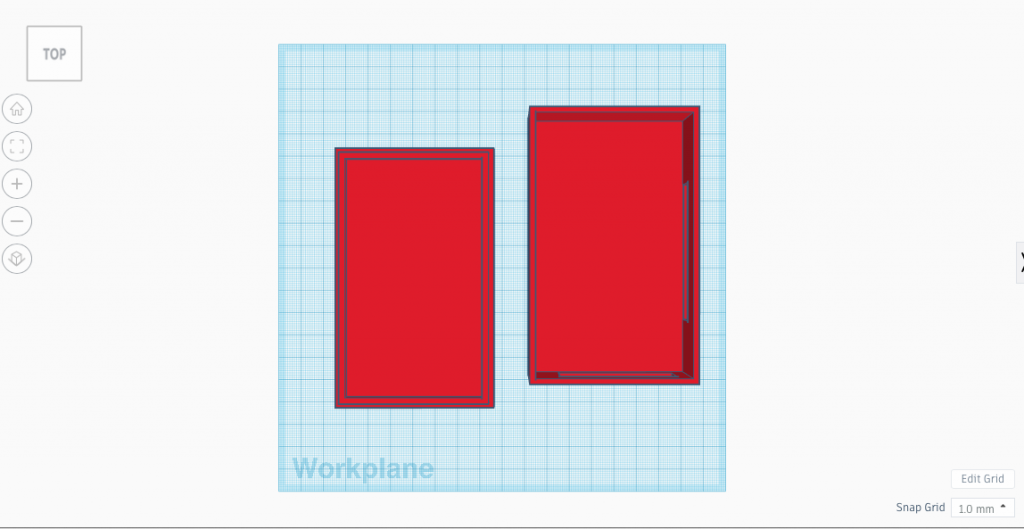
3D printed casing for BITalino
Second Milestone
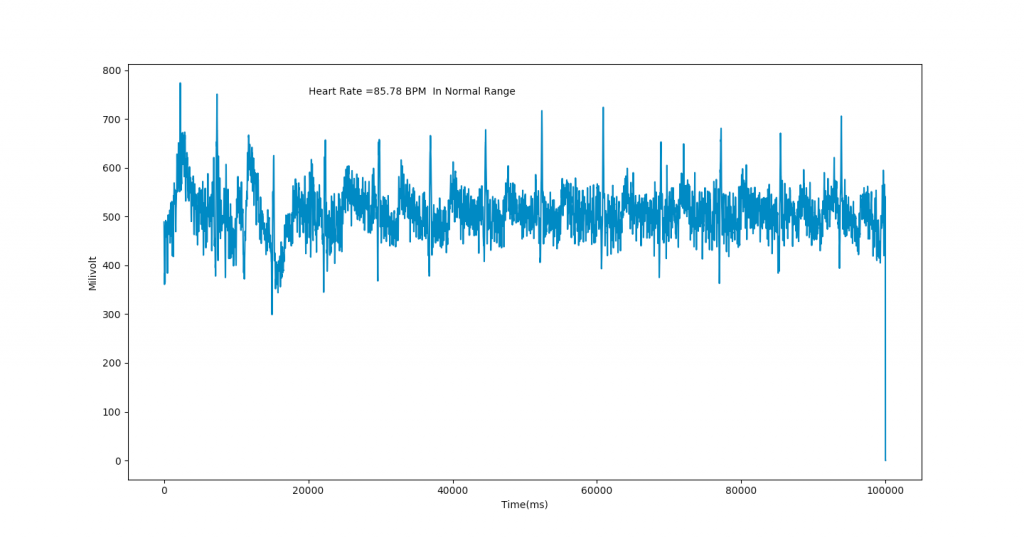
My second milestone is to create a graph to analyze heart rate from ECG sensor data (heart) in order to do my own data analysis through Python using Pylab and Numpy to connect with my BITalino Kit. When I run my code, a graph is shown with the data from OpenSignals and the heart rate on the screen. The beginning of my code is to open the data file from a specific folder. Then, I have written three while loops which have different purposes in creating the graph. The first while loop creates a string array in Python from the data text file. Next, the second while loop finds the number of index values from peaks in data. Lastly, the third while loop finds the differences between peaks of data. The heart rate is then found from these differences through a few calculations in the code. In addition, there are many print commands to make sure while loops are working and text commands for the graph in the code. At first, I was going to use a program called EEGrunt for my graph to connect data from my OpenSignals program and BITalino Revolution Kit. However, EEGrunt can only be used with another device called OpenBCI, not BITalino. I definitely encountered many software errors but I learned a lot more about coding in Python through this experience. Then, I wrote my own code to create this plot and show the heart rate from the data. In the future, I plan to expand on my data analysis by adding more features to my code so that I can measure more from ECG data.
Graph of ECG data from Second Milestone Video
First Milestone
My first milestone is to connect all the sensors from the BITalino to the OpenSignals program to show electrical activity in different parts of the body. The sensors are the EEG for the brain, ECG for the heart, EDA for the nervous system, EMG for the muscles, accelerometer for motion, and light. Specifically, I will demonstrate the EMG sensor for my first milestone video. This sensor measures the electrical activity in the muscles when at rest and when in use. The reference electrode is on the elbow and the positive and negative electrodes are on the muscles attached to your tendon which is a flexible cord that connects all the electrodes together. The channel number should match on the program and the board before testing the sensor. When my arm is rested, the data will stay the same at 0 volts. However, when I move my arm, the activity in my muscles increases as shown from EMG reading. One problem I encountered when connecting the EEG and ECG was that the data did not look right according to sensor datasheets. The problem was in the electrode placement for these sensors. Since the electrode diagrams on the BITalino website were not shown clearly, I had to research other ways to obtain the correct data for each sensor.
BITalino Sensors
MiniPOV 4
MiniPOV Picture